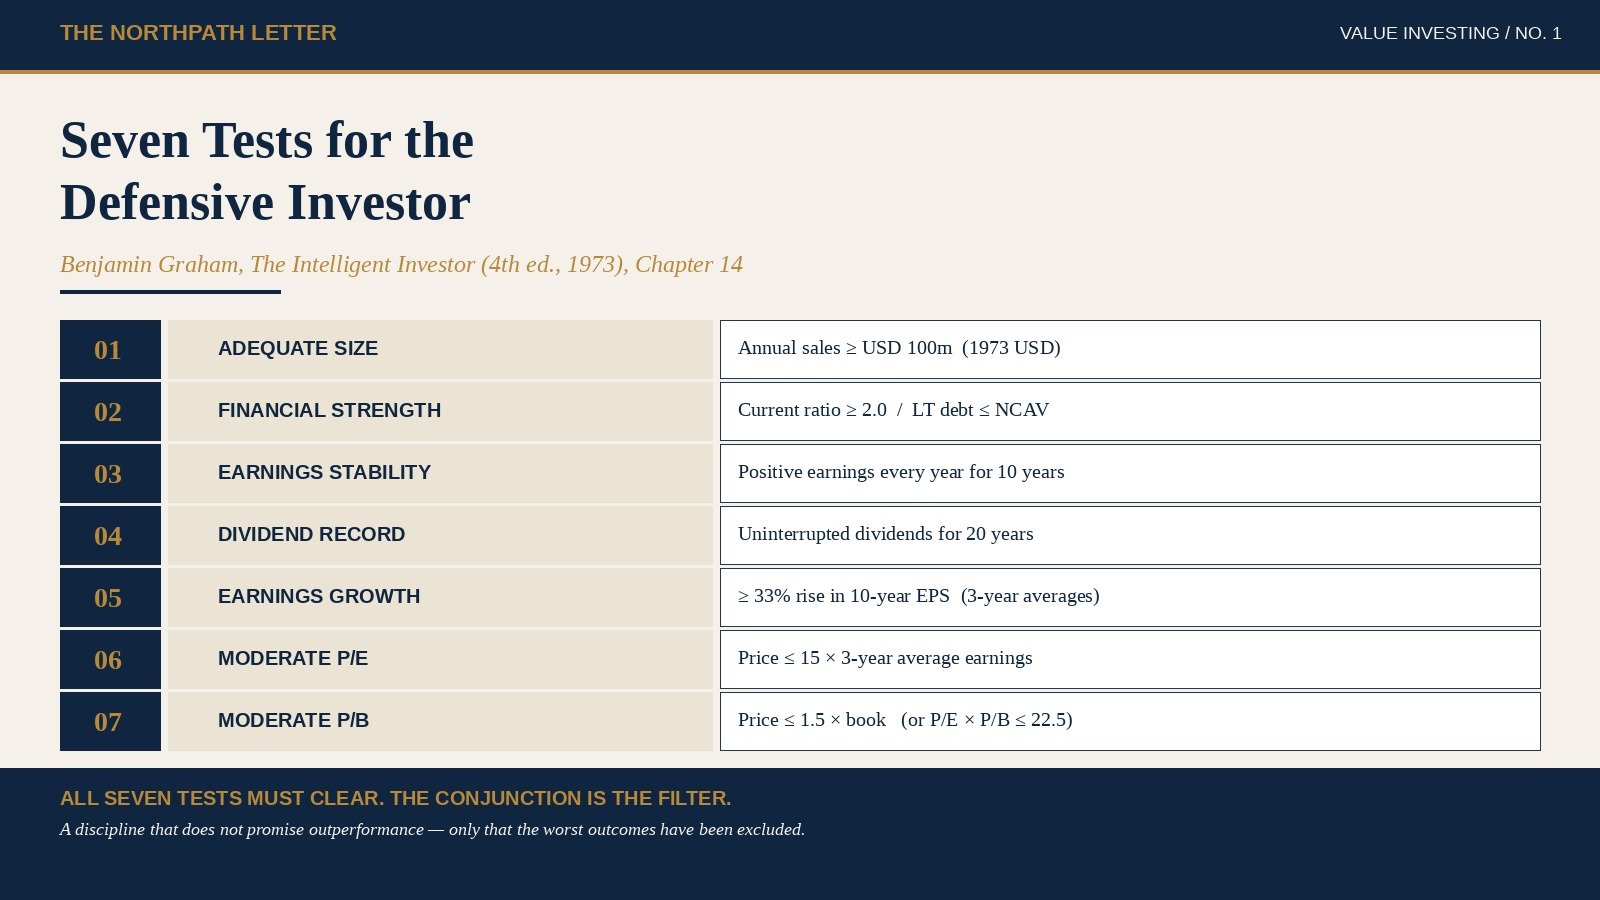
Graham’s Seven Tests for the Defensive Investor: The 1973 Quantitative Screen That Still Filters the Global Equity Universe

valueinv cover defensive investor seven tests graham 1973 quantitative screen

The NorthPath Letter · Value Investing · Morning Edition · 28 May 2026

In the 1973 fourth edition of The Intelligent Investor, Benjamin Graham did something most authors of investment classics never do. He wrote a chapter that any reader could mechanically apply on a Saturday afternoon, at any kitchen table, in any country, against any equity market, without consulting a broker, an analyst, or a chart. He called it “Stock Selection for the Defensive Investor” (Chapter 14). It contained seven numerical tests — size, balance-sheet strength, earnings stability, dividend record, earnings growth, price-to-earnings ratio, and price-to-book ratio. A stock that survived all seven was, in Graham’s words, a candidate for a portfolio that the investor could hold “without losing sleep and without paying close attention.”

The seven tests are not a stock-picking system in the modern sense. They are a filter on the population of listed equities, designed to leave behind only those for which the probability of a permanent loss of capital over a multi-year holding period is structurally low. The screen does not promise outperformance. It promises that you have begun the process of analysis from a universe in which most of the worst outcomes have already been excluded. That is a strikingly modest claim. It is also, in our experience after twenty-two years of practising the discipline, the only claim about a stock screen that does not eventually break.

1. The principle

Graham defined the “defensive investor” as someone “whose chief emphasis will be on the avoidance of serious mistakes or losses; second goal, on freedom from effort, annoyance, and the need for making frequent decisions.” The seven tests were the operational expression of that definition. Each test sets a numerical minimum (or maximum) that a candidate stock must clear. The thresholds, in Graham’s 1973 wording, were:

Test 1 — Adequate size. Annual sales of at least USD 100 million (or, for a public utility, total assets of at least USD 50 million). Graham noted explicitly that this threshold was conservative even in 1973 and that “the result is to exclude small companies which may have unusual vicissitudes.” In 2026 currency, USD 100 million of 1973 sales is approximately USD 700 million to USD 1 billion of inflation-adjusted sales. We will return to this translation problem.

Test 2 — Sufficiently strong financial condition. Two sub-tests, both of which must clear: current ratio of at least 2.0, and long-term debt no greater than the net current asset value (current assets minus all liabilities). Together these put a hard floor under the company’s ability to survive a working-capital squeeze or a refinancing crisis without resort to equity dilution.

Test 3 — Earnings stability. Some earnings for the common stock in each of the past ten years. Note the precise wording: not earnings growth, not consistent returns on capital, simply positive reported earnings every year for a decade. The criterion excludes cyclicals at the peak of their cycle and start-ups that have not yet earned across a full business cycle.

Test 4 — Dividend record. Uninterrupted payments for at least the past twenty years. Graham’s deepest test, and the one that, in our work today, narrows the qualifying universe more aggressively than any other. A twenty-year unbroken dividend record is corroborating evidence that reported earnings have, over two decades, been backed by free cash flow large enough to support a payout through wars, recessions, and changes of management.

Test 5 — Earnings growth. A minimum increase of at least one-third in per-share earnings over the past ten years, using three-year averages at the beginning and end. The three-year averaging is the part most modern screens drop, and it is the part that does the real protective work: it removes the influence of cyclical peaks at either endpoint.

Test 6 — Moderate price-to-earnings ratio. Current price not more than fifteen times average earnings of the past three years.

Test 7 — Moderate price-to-asset ratio. Current price not more than one and one-half times the most recently reported book value. Graham added a softening clause: a lower P/E may justify a higher P/B, and a lower P/B may justify a higher P/E, provided the product of the two multiples does not exceed 22.5. That product test is the origin of what later authors christened “the Graham Number.”

Seven tests. Each test is a number. Each number is verifiable from the audited annual report. The screen requires no access to management, no proprietary database, no view on macroeconomic conditions, and no judgement about industry attractiveness. Graham’s deliberate intention was to construct a filter that a non-expert could apply, that an expert could not improve upon by adding intuition, and that would, in his words, “not leave the investor much exposed to the dangers of the market.”

2. The mechanism — why seven independent filters work

The intellectual content of the seven tests lies not in any single criterion but in their conjunction. Each criterion in isolation is unremarkable. A P/E below fifteen, a P/B below one and a half, a current ratio of two, a dividend record — in any modern stock screener these are standard fields. What makes the Graham screen different is that it requires all seven to clear simultaneously, and the criteria are constructed so that they fail on different kinds of company.

Consider the failure modes. A young company with no operating history fails tests 3 (ten-year earnings) and 4 (twenty-year dividend). A cyclical at the top of its cycle fails test 5 (three-year-averaged growth) and probably test 7 (P/B will be elevated). A leveraged roll-up fails test 2 (long-term debt versus net current assets). A declining business with melting earnings fails test 5 (growth measured between three-year averages). A glamour stock at the top of a bull market fails tests 6 and 7 (P/E and P/B). A capital-light business that has spent the last decade returning cash via buy-backs rather than dividends fails test 4. A small-cap with limited analyst coverage fails test 1.

The seven tests are therefore not redundant. They cover seven distinct sources of permanent capital impairment. The probability that a single stock passes all seven by accident is much lower than the product of the seven individual pass probabilities, because the conditions that produce high scores on one test (cheap multiples, for instance) tend to correlate negatively with the conditions that produce high scores on another (long dividend records, strong balance sheets). The conjunction is, statistically, a powerful filter.

This is why subset versions of the screen — “Graham’s low-P/E screen,” “the Graham Number screen,” “deep-value screens” that drop tests 3 through 5 — tend to perform worse than the full seven over multi-decade windows. Removing any one of the seven dilutes the filter’s ability to exclude a specific failure mode.

Figure 1. How each successive Graham test reduces the qualifying universe. Each test addresses a distinct source of permanent capital impairment; the conjunction is the filter.

3. The empirical record

The most thorough academic test of Graham’s seven criteria remains Henry Oppenheimer’s “A Test of Ben Graham’s Stock Selection Criteria,” published in the Financial Analysts Journal, September–October 1984. Oppenheimer applied subsets of Graham’s criteria to all stocks traded on the New York and American Stock Exchanges between 1974 and 1981 and computed the realised total return of equally weighted portfolios formed from each subset. The full seven-criteria portfolio produced an arithmetic mean return of approximately 26 percent per annum over the eight-year period, against approximately 14 percent for the equally weighted CRSP universe. The premium was not driven by a single year; the seven-criteria portfolio outperformed the broad market in seven of the eight years.

Subsequent academic work has corroborated the result while disentangling the source of the excess return. Cliff Asness, Andrea Frazzini, and Lasse Pedersen of AQR Capital Management, writing in their 2015 paper “Quality Minus Junk,” reconstruct a measurable “quality” factor from criteria closely related to Graham’s tests 2 through 5 — profitability, growth, safety, and payout — and find that this quality factor has produced positive returns across twenty-four developed-market equity indices since the early 1980s. The Asness factor is not identical to Graham’s screen, but the overlap is substantial. The economic content of the seven tests has not decayed.

Jason Zweig’s 2003 commentary in the revised edition of The Intelligent Investor ran the seven-criteria filter against the US equity universe of the early 2000s and produced a sobering finding: the criteria, applied strictly, narrowed the universe to fewer than fifty stocks at most points in the 1995–2002 period. That is, in our view, a feature, not a defect. The screen is supposed to produce a small qualifying universe. A screen that produces five hundred candidates is no longer a filter; it is the market.

It is worth being precise about what the empirical record claims. The seven criteria do not promise that any individual stock passing them will outperform. They claim that, applied as a portfolio formation rule across many years and many regions, the resulting basket has historically produced returns above the market with downside volatility no higher than the market. That is the only claim a defensive screen is meant to make. It has, on the evidence, made it consistently.

4. Two historical episodes

The seven tests are designed to be applied in any market, in any year, but their character is most clearly visible in environments where the qualifying universe either expands or contracts dramatically.

The United States, 1974. The bear market of 1973–74 cut the S&P 500 by roughly 46 percent peak-to-trough and was the deepest equity drawdown since the 1930s. Graham’s fourth-edition revision was published in the middle of that bear market. He wrote in the new chapter that “the recent market decline has produced, for the first time in many years, a substantial number of stocks that meet our criteria.” Oppenheimer’s 1984 study, which began its sample period in 1974, captured exactly this moment. A defensive investor who applied the seven tests in 1974 and held the resulting portfolio for the next decade compounded at roughly twice the rate of the market while taking less drawdown risk. The screen was not predicting the 1975 recovery. It was simply identifying the population of stocks for which the probability of survival was high and the price paid was modest. Survival and modest price did the work.

Japan, 1990–2003. After the Nikkei 225 peaked at 38,915 in December 1989 and proceeded to fall to under 8,000 by 2003, the Japanese equity universe became, for over a decade, the global home of the Graham defensive screen. The combination of a long bear market, a culture of strong balance sheets and high cash balances, twenty-year-plus dividend histories at large industrial groups, and price-to-book ratios systematically below 1.0 across hundreds of companies produced more seven-criteria qualifiers than any market in financial history. The screen was widely written about in international value newsletters during these years (Marc Faber’s Gloom, Boom & Doom Report, Tweedy Browne’s investor letters, Fidelity’s overseas analyst notes), and the period offered an unusually clean test of the discipline: an investor who applied the seven tests to Japanese equities in 2003 and reinvested dividends would have substantially out-compounded the Topix index over the subsequent fifteen years. The discipline travelled. It did not need American conditions to work.

The two episodes are useful precisely because they look so different at the surface. The 1974 case is a normal cyclical bear market in the world’s deepest capital market. The Japanese case is a sui generis fifteen-year deflationary unwinding. The screen produced qualifying baskets in both, and the qualifying baskets produced acceptable long-term returns in both. A discipline that works only in one market structure is brittle. The seven tests, on this evidence, are not brittle.

Figure 2. The qualifying universe expands when markets fall and contracts when they rise. A small universe is a feature of the screen, not a defect.

5. The application framework — three practitioner disciplines

First, apply the criteria additively, not selectively. The seven tests are a logical conjunction. They are not a buffet from which the investor may pick the four that look most attractive in the current regime. We see this error frequently: investors retain tests 6 and 7 (cheap multiples) because the result feels concrete, drop tests 3 and 4 (earnings stability, dividend record) because they feel old-fashioned, and end up holding cyclicals near the top of their cycles. The screen’s protective character disappears entirely when the conjunction is broken. The discipline is binary: either all seven, or none of them as Graham intended.

Second, translate the formula to the holding period. Test 5 measures ten-year earnings growth using three-year averages at the beginning and end. That is a thirteen-year measurement window. The screen was not designed for monthly turnover. An investor who applies the seven tests with the intention of trading the resulting basket over twelve months is applying a screen calibrated for a different problem. Practitioners we respect — Walter Schloss, Tweedy Browne, the partners at Marathon Asset Management — have historically held the median position for three to seven years. The screen has a natural holding period embedded in its arithmetic, and an investor whose horizon is shorter than that horizon should expect the screen to underperform for them.

Third, adjust the size threshold to today’s units, not to today’s stories. The USD 100 million sales threshold of 1973 is roughly USD 700 million to USD 1 billion in inflation-adjusted 2026 terms. It is not a small-cap threshold. Graham himself wrote that the size criterion was the “weakest” of the seven and could be relaxed safely by an investor capable of doing additional balance-sheet work on smaller companies. Tests 2 through 5, by contrast, must not be relaxed. If a candidate company has only seven years of positive earnings rather than ten, the candidate does not pass test 3, and the response is not to lower the threshold — it is to wait three years, or to look at a different company. The numerical thresholds are the discipline; relaxing them is the equivalent of moving a goalpost.

6. How practitioners actually applied it

The seven tests have been used by serious long-term equity investors for more than five decades. Two case studies illustrate how the discipline survives in real portfolios.

Walter Schloss (Walter J. Schloss Associates, 1955–2002). Schloss was a junior analyst at the Graham–Newman Corporation in the late 1940s and went on to run an investment partnership for forty-seven years applying a Graham-style screen. His audited returns, published in Buffett’s 1984 Columbia Business School address “The Superinvestors of Graham-and-Doddsville,” show 15.7 percent annual gross returns over the 1955–1983 period against 11.2 percent for the S&P 500. Schloss did not apply all seven tests mechanically; he placed primary weight on tests 2 (financial strength), 3 (earnings stability), and 7 (price-to-book), with the price-to-book test acting as the binding constraint. He held an unusually large number of positions — often a hundred or more — precisely because his criteria produced a steady stream of qualifying candidates and he refused to concentrate. Schloss ’s case is instructive because it shows that the seven tests can be customised to a practitioner’s temperament without losing their protective character, provided the conjunction of strength, stability, and price remains intact.

Tweedy, Browne Partners (founded 1920, value-investing house since 1959). Tweedy Browne’s 1992 (updated 2009) white paper “What Has Worked in Investing” is the most thorough academic-style retrospective of Graham-style criteria from a practising firm. The paper compiles forty-four separate empirical studies of Graham-derived screens applied across the United States, the United Kingdom, Continental Europe, and Japan from the 1930s through the 2000s. The conclusion is, in our reading, the single most useful sentence written about the seven tests: “Investments characterised by some combination of low price relative to current asset value, low price-to-earnings ratios, low price-to-book ratios, significant insider buying, and consistent dividend records have produced returns substantially above the broad equity market over long measurement periods in every developed market studied.” The firm itself has applied a near-Graham screen to its Global Value Fund since 1993 with audited returns broadly in line with global equity benchmarks while taking materially lower drawdown.

The two firms’ experience converges on the same conclusion. The seven tests are robust to customisation, robust to market structure, and robust to changes in the underlying economy. They are not robust to dilution — that is, to the practice of dropping inconvenient tests — and they are not robust to a holding period shorter than the measurement window they were designed for.

Figure 3. A single-metric P/E screen and Graham's full seven-test conjunction. A wide qualifying universe is a sign that the discipline has been relaxed, not that the market is cheap.
Figure 3. A single-metric P/E screen and Graham’s full seven-test conjunction. A wide qualifying universe is a sign that the discipline has been relaxed, not that the market is cheap.

7. Key takeaways

The defensive investor’s seven tests are a single discipline, not seven separate ones. The conjunction is the filter; dropping any test breaks it.

The screen was designed in 1973 for a holding period of five to ten years. Applying it on a shorter horizon transfers the screen’s benefit to someone else.

The qualifying universe will be small — tens of stocks in a normal market, hundreds in a bear market, near-zero at the top of a bull market. A wide qualifying universe is not a feature; it is a signal that the discipline is being relaxed.

The thresholds (current ratio of two, twenty-year dividend record, ten-year earnings, P/E of fifteen, P/B of one and a half) are not arbitrary. Each test addresses a specific failure mode. Adjustments to the size threshold for inflation are defensible. Adjustments to the others are not.

The seven tests are implementable on free regulatory data — SEC EDGAR in the United States, Companies House and the FCA register in the United Kingdom, EDINET in Japan, the MCA filings and audited annual reports in India, the official gazettes in Continental Europe. The screen does not require expensive databases. It requires patience, arithmetic, and the willingness to do nothing for long periods.

The premise behind all seven tests is unchanged from 1949: in any market, in any decade, the investor’s first task is to assemble a population of candidates from which the worst outcomes have already been excluded. Graham’s discipline does that. After fifty-three years, the screen has earned the right to remain the starting point.

— Manish Goel, FCA / NorthPath Advisory OÜ / Tallinn, Estonia

Important.
All content on this site and in this email is journalism and education for a general audience. Nothing here constitutes investment advice or a recommendation in respect of any specific financial instrument, nor an offer or solicitation to buy or sell any security. Readers should consult an authorised financial adviser regulated in their own jurisdiction before making any investment decision.