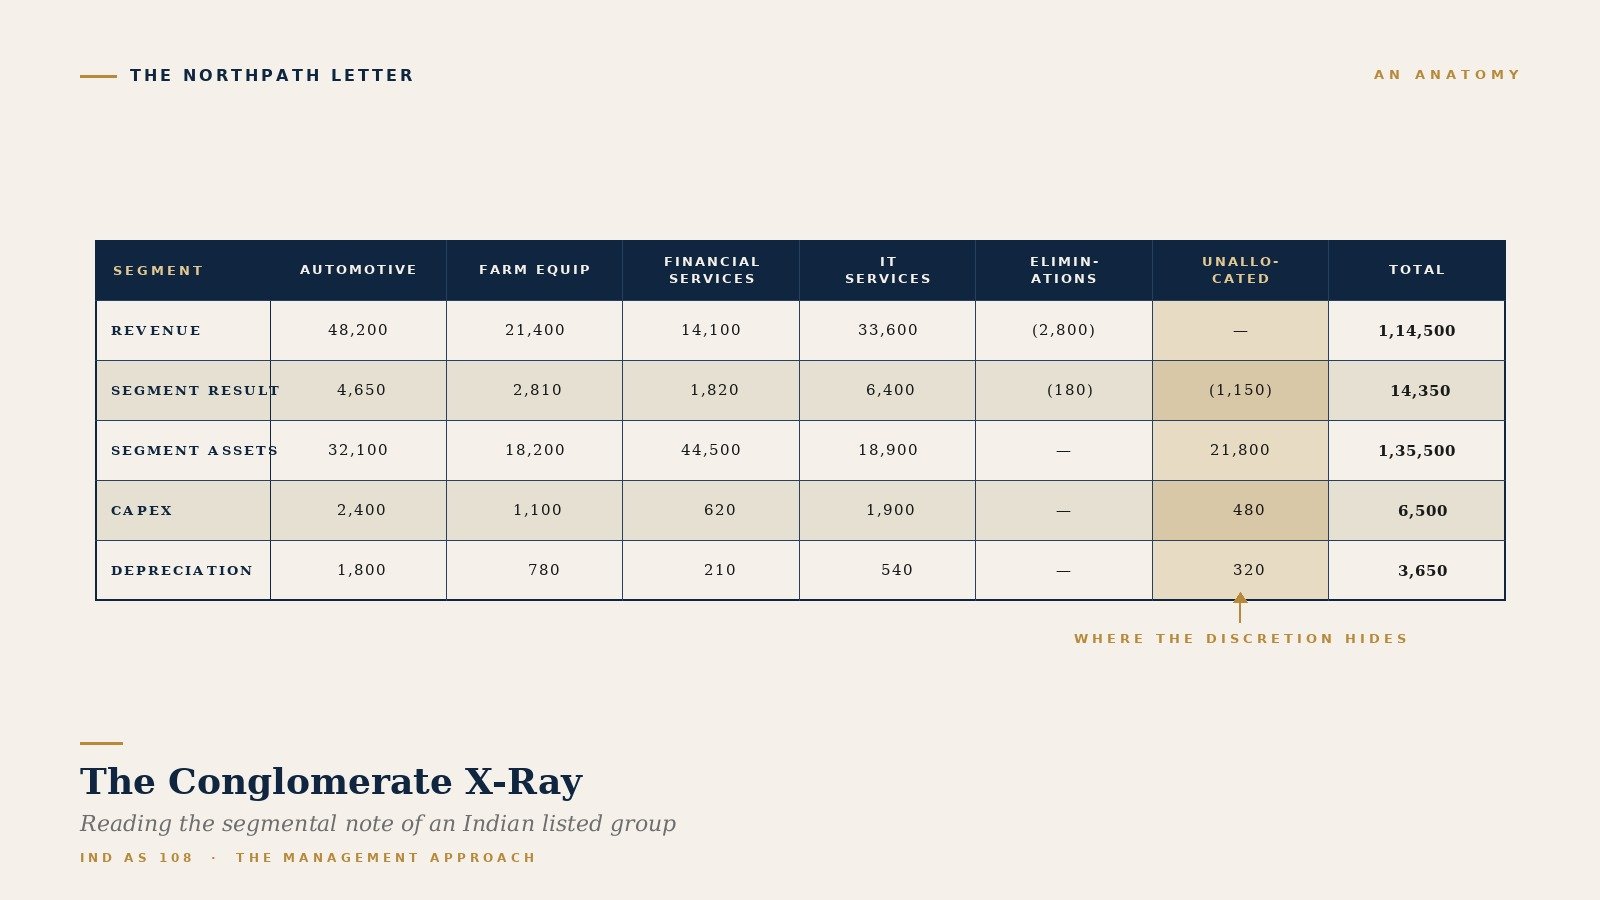
Reading Indian Segmental Disclosures: Ind AS 108, the Management Approach, and the Conglomerate X-Ray

northpath issue8 cover conglomerate

Indian Market Context  ·  26 May 2026  ·  Issue 8

The single consolidated income statement of an Indian group tells you almost nothing about its economics. The segmental note tells you almost everything.

Open the annual report of a large Indian listed company — Larsen & Toubro, Reliance Industries, Mahindra & Mahindra, ITC, Aditya Birla Capital, Grasim, Tata Chemicals, Bharti Airtel — and the consolidated profit and loss statement will show you one number for revenue, one number for cost of materials, one number for employee benefits, one number for finance costs, one number for profit before tax. From that aggregate you can compute a group-level margin and a group-level return on equity, and from those you can construct a plausible-sounding sentence about the business. The sentence will almost always be wrong.

It will be wrong because almost none of those companies is a single business. Larsen & Toubro is a contracting business, a defence-electronics business, a hi-tech-manufacturing business, an IT-services business (LTIMindtree), a financial-services business, a developmental-projects business (concessions, transmission), and a hydrocarbon-services business — and each of those segments earns a different return on capital, deserves a different multiple, and has a different cyclical pattern. Reliance Industries earns money from oil-to-chemicals, from telecom (Jio), from organised retail, from digital media, from oil-and-gas exploration, and from a financial-services arm being spun off — and each line has a different competitive shape. ITC earns most of its EBIT from cigarettes and a small slice from hotels, paperboards, agribusiness, and FMCG-others — and the FMCG-others segment that the market values at one multiple is being subsidised by the cigarettes segment that the market values at a much lower multiple. To talk about “the ROCE of ITC” without knowing the segmental split is to talk about nothing.

The instrument that lets the reader pull apart the consolidated number into its economic constituents is Ind AS 108 — Operating Segments, notified by the Ministry of Corporate Affairs in 2015 under Rule 3 of the Companies (Indian Accounting Standards) Rules, and effective for accounting periods beginning on or after 1 April 2016. Ind AS 108 is the Indian convergence of IFRS 8, the international standard the IASB issued in 2006 in convergence with the FASB’s SFAS 131 (now codified at ASC 280) in the United States. The three standards are now substantively identical: the segmental disclosure block in an Indian annual report, a Korean K-IFRS annual report, a UK plc annual report, and a US 10-K is being prepared under the same conceptual framework. This is a fact worth carrying with you, because it means the moment you learn to read one country’s segmental note, you have learned to read every country’s segmental note.

This letter is a working primer on how to read those disclosures: what the standard actually requires, where the management gets discretion, what the most useful columns are, what the most common red flags look like, and how to translate the segmental table into the four or five economic statements that should be in the head of anyone analysing an Indian conglomerate.

The architecture: the management approach

The single most important word in Ind AS 108 is management. The standard requires that the segments a company reports externally be the same segments it uses internally to allocate resources and to assess performance. Paragraph 5 of Ind AS 108 defines an operating segment as a component of an entity that (a) engages in business activities from which it may earn revenues and incur expenses, (b) whose operating results are regularly reviewed by the entity’s chief operating decision maker (CODM) to make decisions about resources to be allocated to the segment and to assess its performance, and (c) for which discrete financial information is available.

The CODM is a function, not a title. It may be the Managing Director, an executive committee, the Board, or a single Executive Vice Chairman; the standard cares only about who actually receives the internal performance pack and decides where capital and people are pushed. Whoever that is, the external segments must mirror the internal segments. The standard calls this the management approach — and it is a deliberate move away from the older IAS 14 regime, which required entities to report along industry-and-geography axes whether or not management thought about the business that way.

The management approach has one large virtue and one large risk. The virtue is that the external reader sees the business as the operator sees it: real revenue lines, real cost allocations, real capital deployment. When Mahindra & Mahindra reports Automotive, Farm Equipment, IT Services (Tech Mahindra), Financial Services (Mahindra Finance), and Hospitality as separate segments, that is the structure of M&M’s internal P&L review, and the analyst is reading the same numbers the Group CFO is reading.

The risk is that management has discretion over how it draws those internal lines. Two managers running structurally identical businesses can produce different segment notes, and a manager who wants to obscure a weak business can reorganise the internal reporting to bury it. The standard contains aggregation rules and threshold rules designed to limit that discretion, but those rules are themselves judgement-laden. Almost every interesting reading of a segmental note is a reading of where the discretion was exercised.

The five required disclosure lines per segment

For each reportable segment, the standard requires the entity to disclose, at minimum, the following items if they are included in the measure of segment profit or loss reviewed by the CODM, or if they are otherwise regularly provided to the CODM (Paragraph 23):

a) revenues from external customers;
b) revenues from transactions with other operating segments of the same entity (inter-segment revenue);
c) interest revenue;
d) interest expense;
e) depreciation and amortisation;
f) material items of income and expense disclosed in accordance with paragraph 97 of Ind AS 1;
g) the entity’s interest in the profit or loss of associates and joint ventures accounted for by the equity method;
h) income tax expense or income;
i) material non-cash items other than depreciation and amortisation.

It then requires disclosure of the amount of segment assets and segment liabilities for each reportable segment if these are regularly provided to the CODM (Paragraph 23 and 24), together with the amount of investments in associates and joint ventures and the amount of additions to non-current assets (essentially segmental capex).

That is a long list. The line that almost every reader underweights is inter-segment revenue. In a true conglomerate — Reliance selling its own petrochemicals into its own retail business, Mahindra Finance lending to Mahindra dealers, an Aditya Birla cement plant buying captive power from an Aditya Birla power plant — the inter-segment line is the size of the internal economy of the group. If it is large, the consolidated revenue line is materially smaller than the sum of the segmental revenues, and the implicit transfer-pricing decisions inside that elimination are doing real work in shaping which segment looks more or less profitable than another. A reader who looks only at the external-revenue column is reading the group as if those internal linkages did not exist.

The 10% rule and the 75% rule

A segment is reportable if it meets one of three quantitative thresholds (Paragraph 13). It must be separately disclosed if:

a) its reported revenue, including external sales and inter-segment sales, is 10% or more of the combined revenue of all operating segments; OR
b) the absolute amount of its reported profit or loss is 10% or more of the greater of (i) the combined reported profit of all operating segments not reporting a loss, and (ii) the combined reported loss of all operating segments reporting a loss; OR
c) its assets are 10% or more of the combined assets of all operating segments.

The entity may aggregate two or more segments that individually fall below the 10% threshold if they share similar economic characteristics and meet most of the qualitative aggregation criteria in Paragraph 12 — broadly, similar nature of products/services, similar production processes, similar customer types, similar distribution methods, and similar regulatory environments.

There is then a backstop. Paragraph 15 requires that if the total external revenue reported by the operating segments is less than 75% of the entity’s external revenue, additional operating segments must be identified as reportable until the 75% threshold is met. The intent is to make sure that the reportable-segment disclosures cover the bulk of the business, even where the 10% test produces a fragmented picture.

The discretion in those rules clusters at two points. The first is the aggregation criterion: the phrase “similar economic characteristics” is doing a great deal of work, and an aggressive interpretation lets a manager hide a low-margin product line inside a high-margin segment. The second is the classification of a segment as a “single reportable segment”: many Indian small-caps and mid-caps decline to give a meaningful segmental disclosure on the ground that the business is “primarily one segment”, and they do so even when the customer base, product mix, or geography would justify a split. Both manoeuvres are visible to the careful reader and both are worth flagging.

Where the discretion hides: the Unallocated line

The single most consequential line in an Indian segmental disclosure is usually labelled Unallocated or Corporate / Others. It collects everything that management has not chosen to assign to a segment — typically corporate-office costs, treasury income, finance charges on group-level borrowing, group-level tax, and the assets that fund all of these (cash investments, head-office property, group-level intangibles).

The size of the Unallocated line is the size of the gap between segmental reality and consolidated reality. A small Unallocated line, sitting at well under five per cent of total revenue and assets, is a sign that the segmental disclosure is doing most of the work and the reader can rely on it. A large Unallocated line — fifteen, twenty, twenty-five per cent of group assets — is a warning that a material slice of the balance sheet has been deliberately removed from segmental view, and that the segmental ROCE numbers you might compute will be flattered (because the assets are smaller) and the segmental margins will be too high (because the costs that produced those assets are sitting in Unallocated rather than against the revenue they generated).

The careful reader’s first move on opening the segmental note is therefore to read the Unallocated row before reading any segment row. Three questions: What is in it? How big is it relative to the rest of the table? Has it grown faster than the segments? If the answer to the third question is yes, the segmental note has been quietly losing information content over time, and the reader is being asked to take more of the group on management’s word.

The measurement question

Ind AS 108 does not prescribe a single measurement basis for segment profit or segment assets. Paragraph 25 requires only that the disclosed amounts be measured on the basis used internally by the CODM, even where that basis differs from the IFRS-conformant numbers in the consolidated accounts. A company that uses an “adjusted EBITDA” internally is permitted (and required) to report that adjusted EBITDA as the segment performance measure externally, with a reconciliation back to the consolidated profit before tax (Paragraph 28).

That reconciliation column matters. It is the only place in the document where the reader can see, line by line, how internal-management numbers bridge to audited statutory numbers. The bridge contains some combination of: depreciation differences (where the internal accounts use a different useful-life convention), corporate cost allocations not pushed into segments, finance costs and finance income held centrally, exceptional items management has chosen to exclude, and inter-segment eliminations.

The single most informative consolidated-segmental analytical move is to reverse-engineer the reconciliation. Take consolidated PBT. Subtract the total segment-result column. The difference is the sum of all the items management has chosen not to put into the segments. Divide it into its components. If the corporate-cost allocation is large and growing faster than revenue, the segments are being over-flattered. If the finance-cost line is large and held centrally rather than pushed to segments, the segmental return-on-capital numbers will look better than the consolidated ROCE — and the truer picture is somewhere between the two.

Entity-wide disclosures: geography and the 10% customer

The segmental note is followed in every Ind AS 108 disclosure by two entity-wide information blocks that apply regardless of how segments were drawn (Paragraphs 31–34).

The first is the revenue by geography split — revenue attributed to the entity’s country of domicile and revenue attributed to all foreign countries from which the entity derives revenue. The standard requires only “country of domicile” and “all foreign countries” by default, but most large Indian listed companies break the foreign component into regions (Americas, Europe, Middle East and Africa, Asia-Pacific). For an Indian generic pharma company, an Indian IT services company, or an Indian auto-components exporter, this row is the most important single row in the annual report: it tells you the share of revenue that is rupee-denominated and the share that is dollar-denominated, and therefore the operational currency exposure of the business.

The second is the major customer disclosure. If revenues from a single external customer amount to 10% or more of an entity’s revenues, the entity must disclose that fact, the total amount of revenue from that customer, and the segment in which that revenue is reported (Paragraph 34). The standard does not require the customer to be named, and almost no Indian filer names them voluntarily. But the fact that a 10%-customer exists is itself a structural fact about the business: a contract manufacturer with one customer at thirty per cent of revenue is a different business from a contract manufacturer with twenty customers each at five per cent. A reader who skips this disclosure is missing the largest concentration risk in the entire annual report.

A five-step practitioner workflow

Five passes through the segmental note
Figure 1. The five passes a long-term equity reader should make through any Indian segmental disclosure note.

The five passes a long-term equity reader should make through any Indian segmental disclosure:

Pass one — count the segments and weigh the Unallocated line. Count how many reportable segments there are. Compute Unallocated revenue as a share of total revenue, and Unallocated assets as a share of total assets. If Unallocated assets exceed fifteen per cent of total assets, treat the segmental disclosure as a partial picture rather than a complete one.

Pass two — read inter-segment revenue. Compute inter-segment revenue as a share of total segmental revenue. If it exceeds ten per cent, the internal economy of the group is doing meaningful work, and the transfer-pricing decisions inside it are material to which segment looks profitable. Read the accounting policy note to see how inter-segment transactions are priced (the standard answer is “at arm’s-length, similar to third-party transactions”; the honest answer is occasionally otherwise).

Pass three — compute segmental ROCE. For each segment, divide segment result (operating profit, before tax and finance charges) by segment assets. Compare across segments and against the group consolidated ROCE. The segment that earns substantially above the group average is the segment carrying the group, and is usually the segment the market is implicitly paying for. The segments that earn below the group average are using capital that could earn more elsewhere, and the disposition of that capital is a capital-allocation question for the board.

Pass four — read geography. For an Indian listed company with material export revenue, read the entity-wide geography split alongside the segmental result. A segment that produces fifty per cent of group revenue and is sixty per cent dollar-denominated is structurally a different risk from a segment of the same size that is one-hundred per cent rupee-denominated, and the operational hedge that matters most for the group is in this single row.

Pass five — read the major-customer row. If a 10%-customer exists, write its share of revenue down. Trace it to the segment it sits in. Ask whether the segment’s competitive position is the company’s, or whether it is the customer’s. A contract manufacturer with a 25% customer is, in important respects, a wholly owned subsidiary of that customer.

Comparisons that travel: Ind AS 108, IFRS 8, ASC 280

Three standards, one framework
Figure 2. Ind AS 108, IFRS 8 and ASC 280 — the convergence on the management approach, the 10% rule, the 75% backstop, geography and the major-customer disclosure.

For a reader who has worked across jurisdictions, the practical equivalence of the three standards is liberating. Ind AS 108 mirrors IFRS 8 paragraph-for-paragraph; both descended from the FASB’s SFAS 131 of 1997, codified into ASC 280. The three converge on the management approach, the 10% revenue/profit/asset thresholds, the 75% backstop, the aggregation criteria, and the entity-wide disclosures.

The minor practical differences worth knowing are these. ASC 280 requires US filers to disclose revenues by product or service within each segment in slightly more granular form than IFRS 8 and Ind AS 108 require — and accordingly an Indian filer’s product-revenue mix can be coarser than its US peer’s. The IASB amended IFRS 8 in 2013 to require additional aggregation disclosure (where similar economic characteristics were used to aggregate, the entity must say so and describe the characteristics), and Ind AS 108 carries the same requirement. ASC 280 was amended in 2023 (ASU 2023-07) to require disclosure of significant segment expenses that are regularly provided to the CODM — a disclosure that Ind AS 108 and IFRS 8 do not yet require, although the IASB has a parallel project (the segment reporting amendments tentatively finalised in 2024 for IFRS 18 transition) that will bring the two closer.

For the long-term investor reading an Indian filer alongside a US peer, the upshot is that the conceptual framework travels but the granularity occasionally does not. Knowing which jurisdiction has the more demanding disclosure on a given line — and reading the more granular peer first to set the standard of what should be inferred about the less granular filer — is a useful discipline.

The red flags

Five segmental-disclosure red flags
Figure 3. Five patterns worth flagging when they appear in an Indian segmental disclosure.

A handful of patterns are worth flagging when they appear:

The single-reportable-segment declaration in a company whose customer base, geography, or product mix obviously spans more than one segment. The standard permits a single-segment claim only where the business genuinely operates as one segment for internal-review purposes. A company that bundles a domestic FMCG line and a contract-export pharma line into “manufacturing” because both are “manufacturing” is using the standard incorrectly, and a reader is entitled to be sceptical of the rest of the disclosure for the same reason.

The growing Unallocated line. If Unallocated assets have grown from eight per cent of group assets to twenty-two per cent over four years, the segmental disclosure has lost information content faster than the business has grown.

The change of segments without restated comparatives. The standard requires restatement of prior-period comparatives when the segment composition changes (Paragraph 29(b)). A filer that re-cuts its segments and presents only the new period on the new basis, leaving the prior period on the old basis, is making a year-over-year comparison impossible — and almost certainly hiding something on the side that was rearranged.

The margin spread that is too wide to be real. If one segment earns a thirty-five per cent operating margin and another earns a four per cent operating margin in the same group, the cost-allocation policy between them deserves a read. The numbers can be true; equally they can be the consequence of a corporate-cost line sitting entirely against one segment and not the other.

The disappearing major customer. If a major-customer disclosure appeared in year one, disappeared in year two, and the segment that customer sat in did not grow, the customer most likely has not departed — the disclosure has been re-cut so that no individual customer now exceeds the 10% threshold. This is a permitted result of normal disclosure rules; it is also worth noting.

The takeaway

The consolidated income statement of an Indian conglomerate is a press-release object. The segmental note is a working document — the same internal numbers that the Group CFO and the CODM review every quarter, pushed outwards under the discipline of an Ind AS standard that is substantively identical to the IFRS and US frameworks. Reading it as a primer for the business — Unallocated first, inter-segment second, segmental ROCE third, geography fourth, major customer fifth — turns five minutes spent in a footnote into the single most efficient pass through any Indian annual report.

The companies that draw their segments cleanly and report them honestly are the companies whose management actually thinks in those segments. The companies that hide behind a single-segment claim or a swollen Unallocated line are usually the companies whose internal management is hiding from itself as much as from the reader. Either way, the segmental note is telling you which kind of company you are looking at.

— Manish Goel, FCA / NorthPath Advisory OÜ / Tallinn, Estonia

Important.
All content on this site and in this email is journalism and education for a general audience. Nothing here constitutes investment advice or a recommendation in respect of any specific financial instrument, nor an offer or solicitation to buy or sell any security. Readers should consult an authorised financial adviser regulated in their own jurisdiction before making any investment decision.