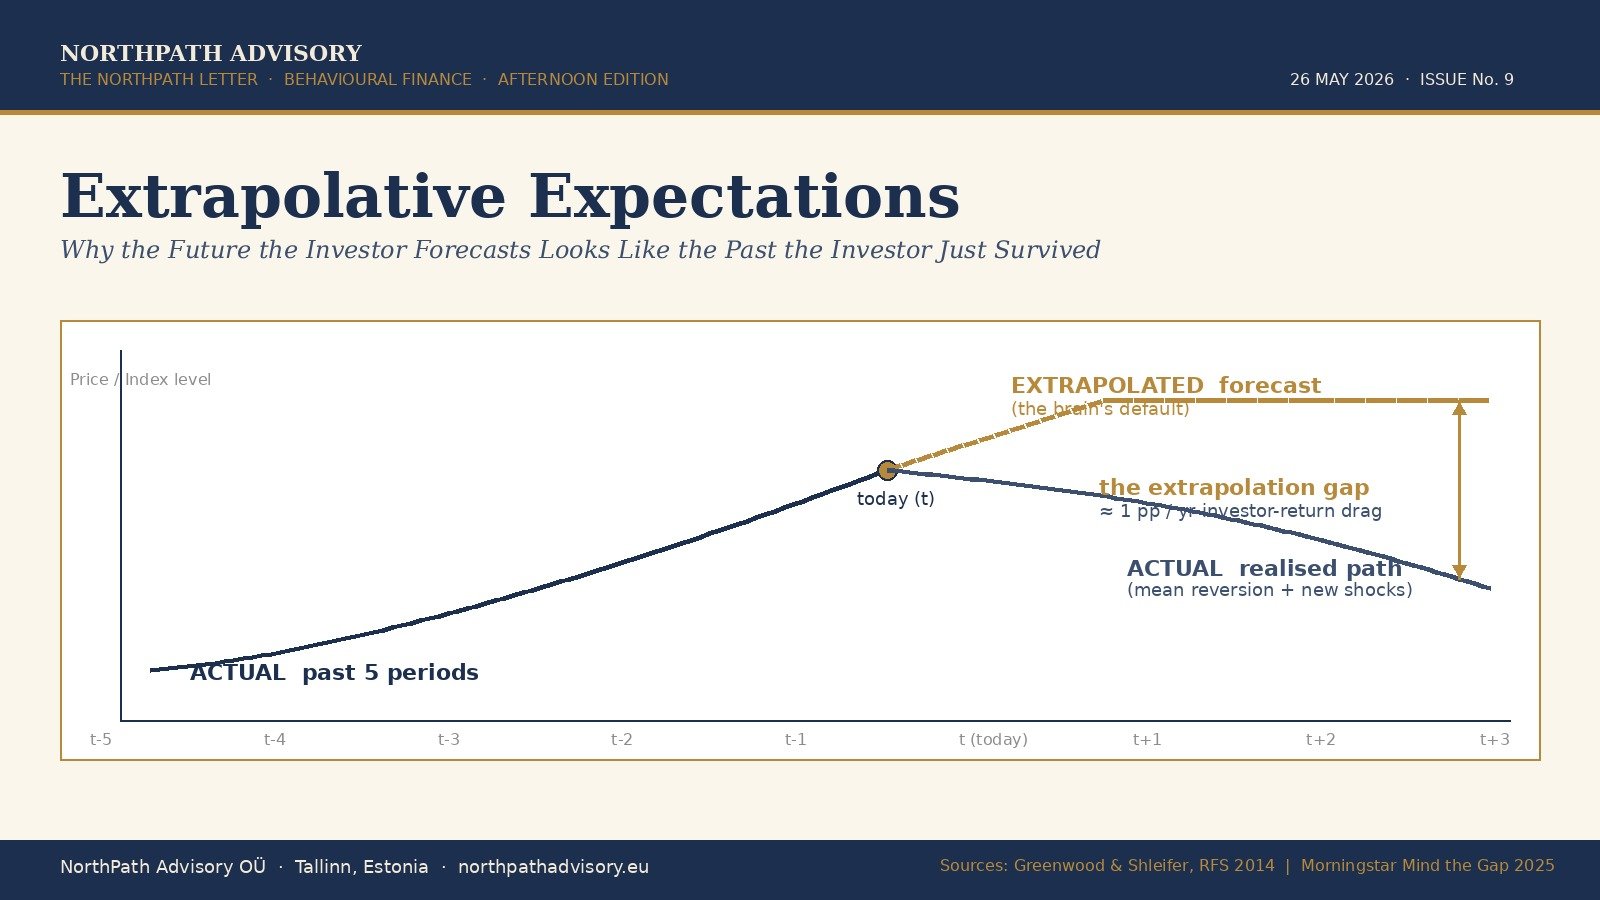
Extrapolative Expectations: Why the Future the Investor Forecasts Looks Like the Past the Investor Just Survived

cover extrapolative

NorthPath Advisory  ·  The NorthPath Letter  ·  Behavioural Finance  ·  Afternoon Edition

In March 2000, with the NASDAQ Composite at 5,048, the American Association of Individual Investors’ weekly survey recorded a six-month bullish reading of 75 percent — a record at the time. In March 2009, with the same index at 1,269 and having lost three-quarters of its value over the preceding nine years, the same survey recorded a bearish reading of 70 percent. The first reading came at a market top; the second at a market bottom. Neither was wrong about the recent past. Both were precisely wrong about the future. This is not a coincidence. It is the most reliably documented finding in the empirical literature on investor expectations, and it has a name: extrapolative expectations.

The argument of this essay is that long-term equity investors who do not understand how their own brain forecasts returns will, with reliable regularity, contribute capital at the worst times and withdraw it at the worst times. The mechanism is older than markets and shared across every domain in which humans must predict an uncertain future from a finite past. The cost, when applied to a multi-decade investment horizon, is measurable, persistent, and large. And the defences — three of them, none of them new — are available to anyone willing to write down what they expect before the market tells them what to expect.

1. The bias: what extrapolative expectations are, and where the idea came from

An expectation is extrapolative when the forecast of the next period is formed by projecting the trend of the past few periods forward. The phrase predates behavioural finance by a century; Alfred Marshall used it in the 1890s to describe how merchants estimated demand. What is specific to the modern behavioural finance literature is the empirical claim that investor expectations of stock-market returns are extrapolative in a strong sense — that they rise after a market has risen and fall after a market has fallen — and that this pattern is sharp enough to dominate the more deliberate, model-based forecasts that any disciplined valuation framework would generate.

The canonical citation is Robin Greenwood and Andrei Shleifer, “Expectations of Returns and Expected Returns,” Review of Financial Studies, vol. 27, no. 3 (March 2014), pp. 714–746. Greenwood and Shleifer assembled six independent survey datasets covering the period 1963 to 2011: the Gallup investor survey, the AAII weekly sentiment poll, the Graham–Harvey CFO survey, Investor Intelligence, Robert Shiller’s individual-investor survey, and the University of Michigan consumer survey. The six measures were positively correlated with one another and with the level of the stock market, and were strongly positively correlated with returns over the trailing twelve months. They were, however, negatively correlated with the model-based expected returns implied by every standard valuation framework — dividend yield, earnings yield, the cyclically adjusted price–earnings ratio. In plain language: when objective measures said future returns would be low, investors expected them to be high; when objective measures said future returns would be high, investors expected them to be low.

The result is not a curiosity of one survey. It survives across countries, across investor types, and across cycle. A related literature finds that the same pattern holds for chief financial officers in the Graham–Harvey survey (Itzhak Ben-David, John Graham, Campbell Harvey, “Managerial Miscalibration,” Quarterly Journal of Economics, 2013) and for institutional fund managers (Nicholas Barberis, Robin Greenwood, Lawrence Jin, Andrei Shleifer, “Extrapolation and Bubbles,” Journal of Financial Economics, 2018). The earlier intellectual ancestor is Werner De Bondt’s 1993 paper “Betting on Trends,” International Journal of Forecasting, which demonstrated that even financial professionals predicted that past trends would continue.

Six investor-expectation surveys, 1963-2011 — correlation signs
Figure 1. Greenwood & Shleifer (2014): across six independent investor-expectation surveys, optimism is positively correlated with the past 12 months of returns and negatively correlated with model-based expected returns.

2. The mechanism: why the brain extrapolates

The cognitive machinery underneath extrapolative expectations is the same machinery Daniel Kahneman and Amos Tversky identified in 1972 under the label of the representativeness heuristic. When asked to forecast an uncertain quantity, the mind does not solve the prediction problem from first principles. It searches recent memory for a similar pattern and treats the most available match as representative of the underlying distribution. Recent returns are the most available pattern; they are also, by definition, the easiest to retrieve. The output of this process is a forecast that looks like the recent past with the trend extended.

Three properties of this process matter for investing. First, the heuristic is unconscious and fast. It runs before any deliberate valuation work begins, and it sets the frame within which the deliberate work then takes place. A valuation that disagrees with the extrapolated forecast is registered, at the level of the brain that decides what feels right, as the work of a contrarian — and contrarian conclusions require additional energy to hold. Second, the heuristic ignores base rates. The historical fact that high price–earnings ratios have, on a forward ten-year basis, been associated with lower subsequent returns is a base-rate fact, and base rates lose to vivid recent narratives in almost every laboratory study ever conducted. Third, the heuristic generates over-confidence in the forecast it produces. Subjects in calibration experiments report higher subjective confidence in extrapolative forecasts than in the corresponding base-rate forecasts, even when the latter are more accurate.

The 2018 Barberis–Greenwood–Jin–Shleifer model formalises this. They build a two-agent market with fundamentalists who price on cash flows and extrapolators who price on momentum. The extrapolators’ demand is not perverse; it is rational given their belief that recent trends will persist. The model reproduces the empirical regularities of bubbles — large run-ups, sharp peaks, slow declines — without assuming any agent is irrational in the strong sense. The bias is in the belief-formation process, not in the trading rule applied to those beliefs. This is the precise diagnosis a long-term investor needs: the failure mode is upstream of the spreadsheet.

3. The empirical record: what the bias costs

The most widely cited measurement of the cost of extrapolative expectations is the gap between published fund returns and the dollar-weighted returns actually earned by investors in those funds. Morningstar publishes this gap annually under the title “Mind the Gap.” The 2025 edition, covering the ten years ended December 2024, found that the average dollar invested in US mutual funds and exchange-traded funds earned 1.1 percentage points less per year than the funds themselves earned — equivalent to approximately 15 percent of total return surrendered to timing alone. The gap was wider for sector equity funds (150 basis points) than for allocation funds (10 basis points), which is consistent with the bias: the more volatile the category and the more vivid the recent trend, the larger the extrapolation error.

The complementary measurement is DALBAR’s Quantitative Analysis of Investor Behavior. The 2025 QAIB report found that in 2024 the average equity-fund investor earned 16.54 percent against the S&P 500 total return of 25.05 percent — a gap of 848 basis points, the second-widest in a decade. Withdrawals from equity funds occurred in every quarter of 2024, with the largest outflows preceding the strongest rebounds. DALBAR’s “Guess Right Ratio,” the proportion of months in which an investor’s net flow direction matched the market’s subsequent direction, fell to 25 percent — statistically indistinguishable from a coin toss biased against the investor.

The two regulator anchors needed for any responsible treatment of this material illustrate how different jurisdictions have intervened in different ways. In India, the Securities and Exchange Board of India requires every mutual fund advertisement that quotes performance to display, in the principal body of the communication, a warning that past performance is no guarantee of future results, and prohibits the use of performance ranking unless accompanied by methodology and the universe from which the ranking was drawn. The relevant master circular consolidates the requirements first issued in 1996 and tightened in 2018 and again in 2024. In the European Union, the Packaged Retail and Insurance-based Investment Products regulation (Regulation 1286/2014) required the introduction of the Key Information Document, and the European Securities and Markets Authority’s 2021 reform of the PRIIPs Regulatory Technical Standards (Commission Delegated Regulation 2021/2268, in force from 1 January 2023) moved the performance scenarios away from a purely past-data extrapolation toward a model-based set of stress scenarios precisely because the previous regime had been shown to systematically over-promise future returns in periods following a market rally. Both regimes are, at root, regulator responses to extrapolative expectations.

Time-weighted fund return vs dollar-weighted investor return
Figure 2. The investor-return gap. Left: Morningstar Mind the Gap 2025 (10 years ended Dec 2024). Right: DALBAR QAIB 2025 (calendar 2024).

4. Two historical episodes

The first episode is the United States in 1998 to 2002. The NASDAQ Composite rose from 1,419 at the end of 1997 to 5,048 in March 2000 — a 256 percent gain over twenty-seven months — and then fell to 1,114 by October 2002. The fund-flow data, compiled by the Investment Company Institute, shows that net new cash to US equity mutual funds in calendar year 1999 was USD 187 billion, the largest in history to that point; in the first quarter of 2000 the run-rate accelerated. Net new cash in 2001 turned negative for the first time since 1988. The aggregate dollar that entered the market did so almost exactly at the index peak and departed near the trough. The retail investor who held the average diversified equity fund for the full period earned, on a dollar-weighted basis, an annualised return materially below the time-weighted return reported by the funds — a gap calculated at the time by Bogle Financial Markets Research Center as approximately 7 percentage points per year over the 1996–2002 window.

The second episode is India in 2017 to 2019. The S&P BSE SmallCap Index rose from 11,460 at the end of 2016 to 20,183 at the close of January 2018 — a 76 percent gain in thirteen months — driven in significant part by retail systematic investment plans into small- and mid-cap mutual funds. Net monthly mutual fund inflows from individual investors in India crossed INR 200 billion in January 2018 for the first time. The index then fell to 11,896 by February 2019, a 41 percent peak-to-trough decline, and to 9,123 by March 2020. Net monthly flows from individuals into equity schemes turned negative in mid-2019 and remained so for most of the next four quarters. The pattern is identical to the 1999–2002 American experience in every respect that matters: the peak of conviction coincided with the peak of price, the trough of conviction coincided with the trough of price, and the dollar-weighted return of the average participant fell short of the time-weighted return of the underlying funds by a margin that was, on a five-year measurement window, several hundred basis points per year.

5. The counter-measure framework: three concrete disciplines

The corrective disciplines all share a single design property: they force a forecast to be committed to before the market provides the answer, so that the extrapolative impulse can be observed and discounted rather than acted upon.

Discipline one — the pre-commitment forecast. Before any purchase, write down a one-page forecast covering five elements: the expected revenue growth rate for the next five years; the expected operating margin at the end of that period; the expected return on incremental invested capital; the multiple at which the business is expected to trade at the end of the holding period; and the implied annualised return at the current price. The discipline is to date the document, file it, and review it on a fixed annual schedule against the realised path. Holdings that have benefited from the realised path are not to be celebrated; the question is whether the original forecast assumptions still apply or whether the price has merely extrapolated the recent trend. This discipline is associated with the formal investment-process literature; the cleanest exposition is in Howard Marks’s The Most Important Thing (Columbia Business School Publishing, 2011), chapter 12.

Discipline two — the base-rate file. For every category of forecast — revenue growth above twenty percent, return on capital above thirty percent, gross margin expansion across a five-year window — maintain a written record of the empirical base rate from comparable historical situations. Michael Mauboussin has documented these base rates extensively in his Credit Suisse Global Financial Strategies reports, in particular “The Base Rate Book” (September 2016). The discipline is to compare any internal forecast against the documented base rate before submitting it. A forecast more than one standard deviation above the base rate is not necessarily wrong, but the burden of evidence required to justify it must be commensurate with the gap. Extrapolative expectations are precisely the engine that produces forecasts well above base rates; the file is the friction that slows the production.

Discipline three — the asymmetric review. Schedule the longer and more rigorous of the two annual portfolio reviews for the period after a market or sector decline, not after a rally. This inverts the natural human tendency to scrutinise positions when they are causing pain and to leave them alone when they are providing pleasure. The mechanism it defeats is the asymmetry of attention that extrapolation creates: a position that has compounded at twenty-five percent for three years feels like a thesis confirmed, when it is at least as likely to be a thesis priced. The review need not be punitive; it need only be honest about whether the present price has begun to imply, by way of multiple expansion, a forward path that exceeds the base rate. The asymmetric review is the formalisation of John C. Bogle’s lifelong observation, repeated in Common Sense on Mutual Funds (Wiley, 1999), that “reversion to the mean is the iron rule of the financial markets.”

Three disciplines that limit extrapolation
Figure 3. Three disciplines that limit extrapolation: pre-commitment forecast, base-rate file, asymmetric review.

6. How two long-term-equity practitioners addressed it

John C. Bogle, the founder of the Vanguard Group and the author of Common Sense on Mutual Funds, treated extrapolative expectations as the principal antagonist of the retail investor and built an institution around the assumption that the antagonist could not be defeated by exhortation. His chosen instrument was the index fund — an investment vehicle that mechanically rebalances away from the most-extrapolated assets and toward the least-extrapolated assets, without requiring the investor to override any cognitive process. Bogle’s own writing was unambiguous about the diagnosis. In the 1999 edition of Common Sense on Mutual Funds, chapter four, he documents that the dollar-weighted return of the average US equity fund investor between 1984 and 1998 had been 7 percentage points per year below the time-weighted return of the funds themselves, and he attributes the gap directly to the chasing of recent performance. The remedy was structural: take the choice of when to act out of the investor’s hands.

Howard Marks, the founder of Oaktree Capital Management, addressed the same problem from the opposite direction, through the medium of the memo. Beginning in 1990 and continuing for thirty-five years, Marks’s quarterly memos to Oaktree’s clients have systematically described where, in the cycle of investor mood, the market sits at the time of writing. The memos do not contain forecasts of price levels or returns. They describe what Marks calls the “pendulum of investor sentiment” — the alternation between greed and fear, between extrapolation upward and extrapolation downward — and locate the present moment on that pendulum. Marks’s 2018 book Mastering the Market Cycle (Houghton Mifflin Harcourt) collects the analytical framework that the memos rehearse. The discipline is not to predict the turn but to know where in the cycle one is standing, so that the natural extrapolative impulse can be inspected before it is acted on. Both practitioners arrived at the same conclusion: extrapolative expectations cannot be reasoned away, but they can be structurally limited or behaviourally observed.

7. Key Takeaways

  • Investor expectations of future stock-market returns are systematically extrapolative. Six independent survey datasets covering 1963–2011 show that expectations rise after the market rises and fall after the market falls, and are negatively correlated with model-based expected returns (Greenwood & Shleifer, Review of Financial Studies, 2014).
  • The measured cost of this bias is approximately 1 percentage point per year, or 15 percent of total return over a decade, per Morningstar’s “Mind the Gap” 2025 study. DALBAR’s 2025 QAIB report found an 848-basis-point gap in the single year 2024 alone.
  • The bias is generated upstream of any spreadsheet. It is the output of the representativeness heuristic (Kahneman & Tversky, 1972) operating on recent returns, which means it cannot be corrected by improving valuation work alone.
  • Three disciplines limit its operation: the dated pre-commitment forecast, the written base-rate file, and the asymmetric review that scrutinises winners more than losers.
  • Two practitioner traditions illustrate the structural and the behavioural responses respectively: Bogle’s index-fund architecture removes the discretion that the bias would otherwise capture; Marks’s memos formalise the inspection of one’s own sentiment before any large allocation decision.

— Manish Goel, FCA / NorthPath Advisory OÜ / Tallinn, Estonia

Important.
All content on this site and in this email is journalism and education for a general audience. Nothing here constitutes investment advice or a recommendation in respect of any specific financial instrument, nor an offer or solicitation to buy or sell any security. Readers should consult an authorised financial adviser regulated in their own jurisdiction before making any investment decision.