Probability Weighting and the Fourfold Pattern: Tversky and Kahneman’s 1992 Cumulative Prospect Theory and Why the Long-Term Investor Routinely Misprices Both Tails of the Distribution

cover probability weighting

Behavioural Finance · Afternoon Edition · 27 May 2026

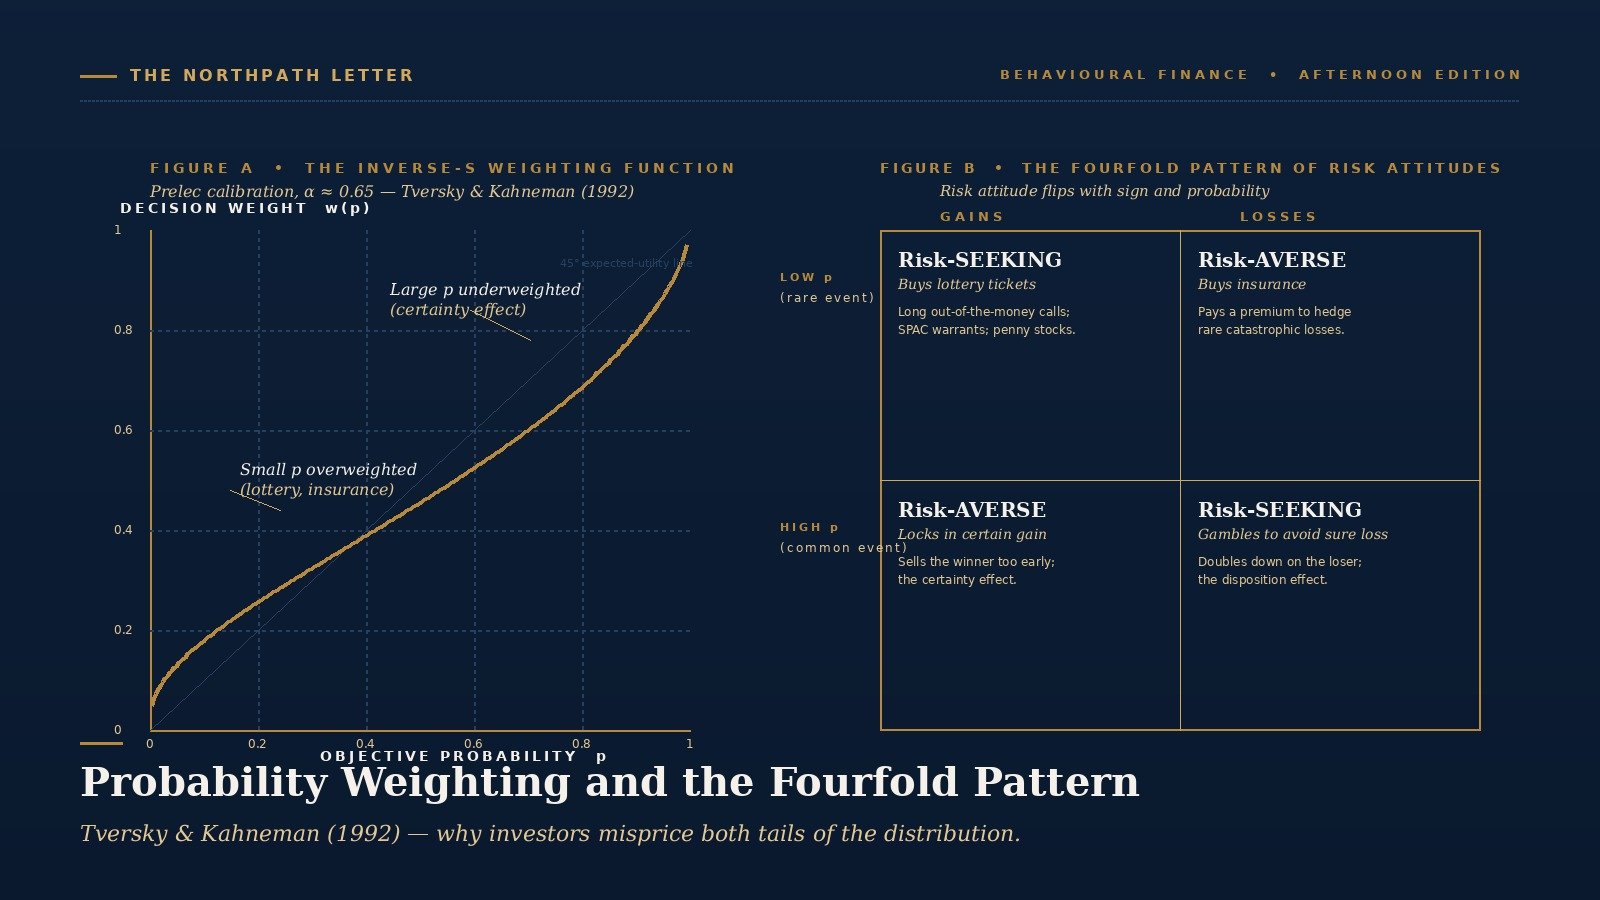
In December 1992, in a special issue of the Journal of Risk and Uncertainty, Amos Tversky and Daniel Kahneman published a thirty-page paper titled “Advances in Prospect Theory: Cumulative Representation of Uncertainty.” It revised the 1979 paper that had launched prospect theory and replaced the original probability-weighting machinery with a rank-dependent one that worked for arbitrary outcomes. Buried inside the algebra was an empirical claim with consequences for every long-term investor. Tversky and Kahneman called it the fourfold pattern. Risk attitudes, they showed, are not a property of a person. They are a property of the cell in which the person is standing. Move from a low-probability gain to a high-probability gain — or from gains to losses — and the same person flips from risk-seeking to risk-averse, or back again, without noticing. The mechanism behind the flip is a non-linear function called the probability weighting curve, which over-weights small probabilities and under-weights large ones. The investor who does not see the function distorting his judgement will mis-price both tails of the distribution he is trying to invest in.

The bias and its canonical citation

Prospect theory began life as a 1979 Econometrica paper that argued people evaluate gambles relative to a reference point, are loss-averse around that reference point, and treat probabilities not as objective likelihoods but as weights that are systematically distorted. The 1992 paper sharpened the third claim. Cumulative prospect theory introduced a rank-dependent weighting function that can be calibrated from experimental data. Across thousands of choices, Tversky and Kahneman estimated a median weighting function with two properties. First, w(p) is greater than p for small probabilities — a one-percent chance is treated as if it were closer to seven percent. Second, w(p) is less than p for moderate-to-large probabilities — a ninety-nine-percent chance is treated as if it were closer to ninety-four. The function is concave near zero, convex near one, and shaped like an inverted S. The four corners of the resulting decision space — small probability gain, small probability loss, large probability gain, large probability loss — produce four different risk attitudes. Risk-seeking for small-probability gains. Risk-averse for small-probability losses. Risk-averse for large-probability gains. Risk-seeking for large-probability losses. That is the fourfold pattern.

The inverse-S probability weighting curve, calibrated from Tversky and Kahneman 1992
Figure 1. The inverse-S probability weighting curve, Prelec single-parameter form with α ≈ 0.65, calibrated from Tversky and Kahneman (1992).

The mechanism behind the curve

The cognitive architecture that produces the weighting function has been studied for thirty years. Three forces combine. The first is diminishing sensitivity: the psychological difference between zero and one percent feels larger than the difference between forty and forty-one percent, which feels larger in turn than the difference between ninety-nine and one hundred percent. The endpoints of the probability scale carry a disproportionate weight. The second is category boundary effects: probabilities near zero are mentally categorised as “possible” rather than “impossible,” and the jump from impossible to possible feels qualitatively larger than the slope of the line would suggest. The same is true at the top of the scale, where the jump from “very likely” to “certain” feels qualitatively larger than the underlying gap. Kahneman labelled this last force the certainty effect in the 1979 paper. The third force is limited mental resolution: the mind handles “small,” “medium,” and “large” well, but it does not handle fine gradations of small. A one-in-ten-thousand event and a one-in-a-million event collapse into the same emotional category, which is why a single vivid news story can persuade a person that an event with a six-decimal-place probability is now imminent.

The combination produces the inverted-S shape. The weighting function is steepest near the endpoints and flattest in the middle. In the middle of the curve — roughly the band from twenty to seventy percent — objective and subjective probability are tolerably close. Outside that band, distortion sets in. And because long-term equity investing routinely asks investors to assess events that live in the tails — the chance a small biotech reaches commercialisation, the chance a turnaround actually turns, the chance a leveraged firm survives a recession, the chance a once-in-a-decade dislocation arrives this decade — the investor spends most of his time in the part of the curve where the function is most distorted.

The curve also explains a second puzzle that classical finance struggles with. Why are people willing to pay both for a lottery ticket and for an insurance premium against the same expected value? The expected-utility framework requires that a person be either risk-seeking or risk-averse, not both at once. The fourfold pattern dissolves the puzzle. The same individual, looking at a small-probability gain, is risk-seeking and buys the ticket; looking at a small-probability loss, is risk-averse and buys the policy. The lottery counter and the insurance counter live in the same shopping mall because the curve has the same shape on both sides of the reference point. For the equity investor the practical implication is that any thesis written entirely in the language of upside — “the probability the technology works,” “the probability the addressable market is as forecast” — will be distorted upward, and any thesis written entirely in the language of downside — “the probability the regulator forces a recall,” “the probability the litigation produces an adverse ruling” — will be distorted in the opposite direction. The cure is to write the same thesis from both ends, and to compare the two probability statements line by line.

The empirical record

Three families of evidence have accumulated. The first is laboratory. Camerer’s 1995 Handbook of Experimental Economics chapter reviewed several hundred replications of the original Tversky and Kahneman experiments. The fourfold pattern is one of the most robust findings in the entire experimental literature; the median weighting function recovered from a fresh sample of laboratory subjects in any decade since 1992 sits within a narrow envelope of the original curve. The Prelec single-parameter form, with α near 0.65, fits both Tversky and Kahneman’s median data and most subsequent re-estimations.

The second family is field. Alok Kumar’s 2009 Journal of Finance paper “Who Gambles in the Stock Market?” tracked 70,000 retail brokerage accounts and showed that holders of low-priced, high-volatility, positively-skewed stocks — the precise profile predicted by the probability weighting function as attractive to lottery-loving investors — under-performed matched peers by two to three percentage points a year. Barberis and Huang, in a 2008 American Economic Review paper titled “Stocks as Lotteries,” built an equilibrium asset pricing model around the same prediction and showed that lottery-like stocks are systematically over-priced relative to a CAPM benchmark, with a measurable negative excess return. The probability weighting function is now a standard cross-sectional pricing factor in academic finance.

Three empirical anchors for the probability weighting bias from regulators and academic literature
Figure 2. Three empirical anchors for the probability weighting bias, drawn from regulator data and academic finance.

The third family is regulatory. The European Securities and Markets Authority published a product intervention package in March 2018 that banned the marketing, distribution and sale of binary options to retail investors and imposed leverage and margin-close-out limits on contracts for difference. The supporting national competent authority analyses, summarised in the published rationale, showed that between seventy-four and eighty-nine percent of retail accounts trading these products lost money, with average losses per client running from sixteen-hundred euros to twenty-nine-thousand euros. ESMA’s public language was careful and clinical: the products had “structural expected negative return,” the documented retail outcomes were inconsistent with rational pricing, and the “disparity between expected return and risk of loss” warranted permanent intervention. The Financial Conduct Authority in the United Kingdom reached an adjacent conclusion in 2020. In policy statement PS20/10, the FCA prohibited from January 2021 the sale of cryptoasset derivatives and exchange-traded notes to retail clients, citing “extreme volatility,” absence of a reliable valuation basis, and the conclusion that retail consumers could not reliably assess the value and risks of the products. Two regulators, two jurisdictions, the same empirical signature: retail demand was concentrated in instruments whose return profile is structurally attractive to a probability-weighted decision-maker and structurally unattractive to an expected-value one.

Two historical episodes

The first episode is the 2020-2021 special-purpose acquisition company cycle in the United States. More than six hundred SPACs were listed in 2020 and 2021, raising roughly one hundred sixty billion dollars. The pitch — a blank-cheque vehicle that would, with some probability, merge with a high-growth private business at a favourable valuation — was a paradigmatic small-probability, large-payoff proposition. The fourfold pattern’s top-left quadrant predicts exactly that kind of demand: retail investors should bid for the SPAC warrants and post-merger shares at prices that over-weight the probability of a transformative deal. The data, once enough mergers had closed to permit measurement, vindicated the prediction. A 2023 review in the Yale Journal on Regulation reported that the 2021 cohort of de-SPAC mergers had lost an average of sixty-seven percent of their value from the de-SPAC price, the 2022 cohort fifty-nine percent, and the combined post-merger excess return relative to the Nasdaq was negative forty-four percent. The cycle was the most expensive demonstration in modern markets of the difference between objective probability and decision weight on low-frequency, high-skew outcomes.

The second episode is older and structurally similar. Between the late 1990s and 2000, retail investors in the United States poured capital into low-priced internet stocks with negative or non-existent earnings and option-like return profiles. Many of these were micro-cap names with valuations supported entirely by extrapolated traffic metrics. Kumar’s subsequent academic work treated this cohort as a natural experiment in lottery-stock demand, and showed that the cross-section of underperformance among individual investors was concentrated almost entirely in this segment. The 1998-2000 episode and the 2020-2021 episode differ in vintage and technology, but the cognitive signature is the same. Both cycles concentrated retail capital in the precise corner of the outcome space where the probability weighting function is most distorted, and in both cycles the realised long-run return was deeply negative.

A third regulatory data point is worth recording because it covers a different region and a different instrument. The French Autorité des Marchés Financiers published in 2014 a study of 14,799 active retail accounts trading forex and binary options on French-licensed platforms between 2009 and 2012. The headline finding was that eighty-nine percent of these accounts lost money over the four-year window, with cumulative net losses of approximately one hundred seventy-five million euros against gross winnings of thirteen million for the top decile. The AMF’s subsequent advertising restrictions, followed by ESMA’s 2018 pan-EU intervention, were the response. Three jurisdictions, two continents counting the United States Commodity Futures Trading Commission’s parallel binary-options enforcement actions, and the same empirical curve. The bias is not a feature of any particular market or generation; it is a property of the species.

The counter-measure framework: three concrete disciplines

The fourfold pattern does not yield to wishful thinking. Tversky himself observed that decades of laboratory exposure to the bias did not eliminate it in his own subjects, including those who had taught the original papers. What it yields to is procedural pre-commitment — rules that operate before the distorting machinery has a chance to engage. Three disciplines have an evidence base.

Discipline one: decompose every thesis into base rate times payoff. Before sizing any position whose investment case turns on a low-probability, high-magnitude outcome, the investor writes down two numbers. The first is the probability the thesis implicitly assigns to the favourable scenario. The second is the closest available base-rate from the academic or industry literature. The gap between the two is the investor’s personal probability weighting distortion. If the gap is wide and the investor cannot defend it in writing with case-specific evidence, the position has not yet passed the first gate. This is the discipline behind Howard Marks’s “second-level thinking” and behind Annie Duke’s “thinking in bets” framework, both of which trace, in their methodological roots, to the cumulative prospect theory literature.

Three procedural disciplines that counter the inverse-S weighting function
Figure 3. Three procedural disciplines that re-anchor the investor to the base rate of the distribution.

Discipline two: cap the tail-bet line item. Even when a low-probability, high-payoff thesis is well-defended, the appropriate position size is small. The asymmetry of the weighting function means that the investor will, on average, over-pay for such a position; capping it bounds the cost of being wrong. A defensible ceiling for tail-bet positions in aggregate — the sum of all positions whose investment case depends on a low-probability event — is in the two-to-three percent range of the portfolio. The cap is not a forecast of how often the thesis will pay; it is a recognition that the human brain pricing the bet will be working with a distorted weighting function, and that prudent sizing must include a haircut for that distortion.

Discipline three: pre-write the kill criteria. The bottom-right cell of the fourfold pattern — risk-seeking under a high-probability of loss — is the one that converts a manageable mistake into a permanent loss. Once a position has moved significantly against the thesis, the same weighting function that overpaid for it on entry now generates risk-seeking behaviour: the investor doubles down, holds longer, refuses to crystallise the loss. The only known antidote is to write down, ex ante, the quantified evidence that would falsify the thesis — the milestone missed, the metric breached, the audit qualification issued, the legal claim filed — and to act mechanically when that evidence arrives. Investors who pre-commit in writing exit losing theses three to six months earlier than investors who do not, with a measurable saving of compounded capital.

How long-term-equity practitioners addressed it

Two practitioners are useful anchors. The first is Howard Marks, co-founder of Oaktree Capital. Marks has written for thirty years about asymmetric risk-reward, and his memos return repeatedly to a single discipline: ask what can go wrong before asking what can go right. Marks’s “I-know school” versus “I-don’t-know school” framing, articulated in the 2004 memo of the same title, is operationally a probability weighting counter-measure. The “I-know” investor sees a low-probability favourable scenario, weights it as if it were medium-probability, and pays the corresponding price. The “I-don’t-know” investor treats the same scenario as low-probability because the base rate says so, and pays a price that admits the wide error band. Oaktree’s long history of distressed-debt outcomes is, at the cognitive level, a long history of refusing to pay a probability-weighted price for a tail outcome.

The second is Warren Buffett, whose insurance operations at Berkshire Hathaway constitute the most studied counter-measure in modern long-term equity investing. Berkshire’s reinsurance business, run for thirty-five years by Ajit Jain, prices catastrophe risk — large losses that occur with low probability — and is profitable on a cumulative basis precisely because it refuses to write business at prices that imply over-weighted small probabilities. Buffett’s annual letters describe the discipline plainly: the underwriter must price what the long-run loss distribution will deliver, not what the present demand curve says the market will pay. Berkshire has walked away from significant blocks of premium when, in Buffett’s phrase, “the price was too low for the risk.” The same logic governs the operating businesses. Berkshire avoids capital-intensive growth bets whose narrative case rests on a low-probability winner-takes-all outcome and concentrates instead on businesses with durable economics and a defensible base rate of survival. The portfolio is built quadrant by quadrant of the fourfold pattern, not against it.

Key takeaways

The fourfold pattern is a feature of the human cognitive system, not a flaw of the individual investor. Probability weighting is non-linear in everyone studied. Decades of teaching the bias do not eliminate it. The only working defence is procedural.

The function distorts both tails of the distribution. Lottery-stock demand and over-priced insurance both follow from the same curve. An investor who has corrected for the lottery side without correcting for the certainty-effect side has done half the work.

Regulators have already documented the bias at scale. ESMA’s 2018 binary-options and CFD intervention and the FCA’s 2020 crypto-derivative ban are, methodologically, large-sample empirical studies of probability weighting in retail markets. Their findings should be read as evidence about the strength of the bias, not as quirks of a few products.

The discipline is base rate first, payoff second, sizing third, kill criteria fourth. All four are written down ex ante. The investor who skips any of the four is leaving the weighting function unsupervised.

Long-term equity outcomes are dominated by the avoidance of the bottom-right quadrant. The risk-seeking response to a high-probability of loss — doubling down, refusing to sell — is what converts a recoverable mistake into a permanent capital impairment. The pre-written kill criterion is the single most underused tool in the long-term investor’s kit.

— Manish Goel, FCA / NorthPath Advisory OÜ / Tallinn, Estonia

Important.
All content on this site and in this email is journalism and education for a general audience. Nothing here constitutes investment advice or a recommendation in respect of any specific financial instrument, nor an offer or solicitation to buy or sell any security. Readers should consult an authorised financial adviser regulated in their own jurisdiction before making any investment decision.