The Long Tail of Equity Returns: Hendrik Bessembinder’s 2018 and 2023 Findings, and What They Demand of the Long-Term Investor

valueinv cover bessembinder long tail equity returns 2018 2023

VALUE INVESTING  ·  25 MAY 2026  ·  ISSUE 6

The most expensive sentence in long-term equity investing is the one no spreadsheet ever models: most stocks lose money, and a small handful build essentially all the wealth. The intuition that “the market goes up” — the cheerful arithmetic behind every retirement projection ever drafted in a bank branch — is true only as an aggregate of an extremely asymmetric distribution. Pull the average apart and what you find is a long tail of failure, a wide middle of indifference, and a tiny right edge of compounding so extreme that it carries the entire history of equity returns on its back.

Hendrik Bessembinder, a finance professor at Arizona State University’s W. P. Carey School, did the arithmetic that other people had assumed without checking. His 2018 paper, Do Stocks Outperform Treasury Bills? in the Journal of Financial Economics, took every common stock that ever traded on a U.S. exchange between July 1926 and December 2016 and tracked the lifetime dollar wealth each one created above a one-month Treasury-bill benchmark. The result reorganised the way a careful long-term investor should think about diversification, concentration, holding periods, and the value of patience. His 2023 follow-up, co-authored with Te-Feng Chen, Goeun Choi and K. C. John Wei in the Financial Analysts Journal, repeated the exercise across 64,000 stocks in 42 countries between 1990 and 2020. The pattern held everywhere it was measured.

This letter is not a meditation on power laws. It is a working framework for what these two papers should do to the discipline of an investor whose horizon is measured in decades rather than quarters.

1. The Principle

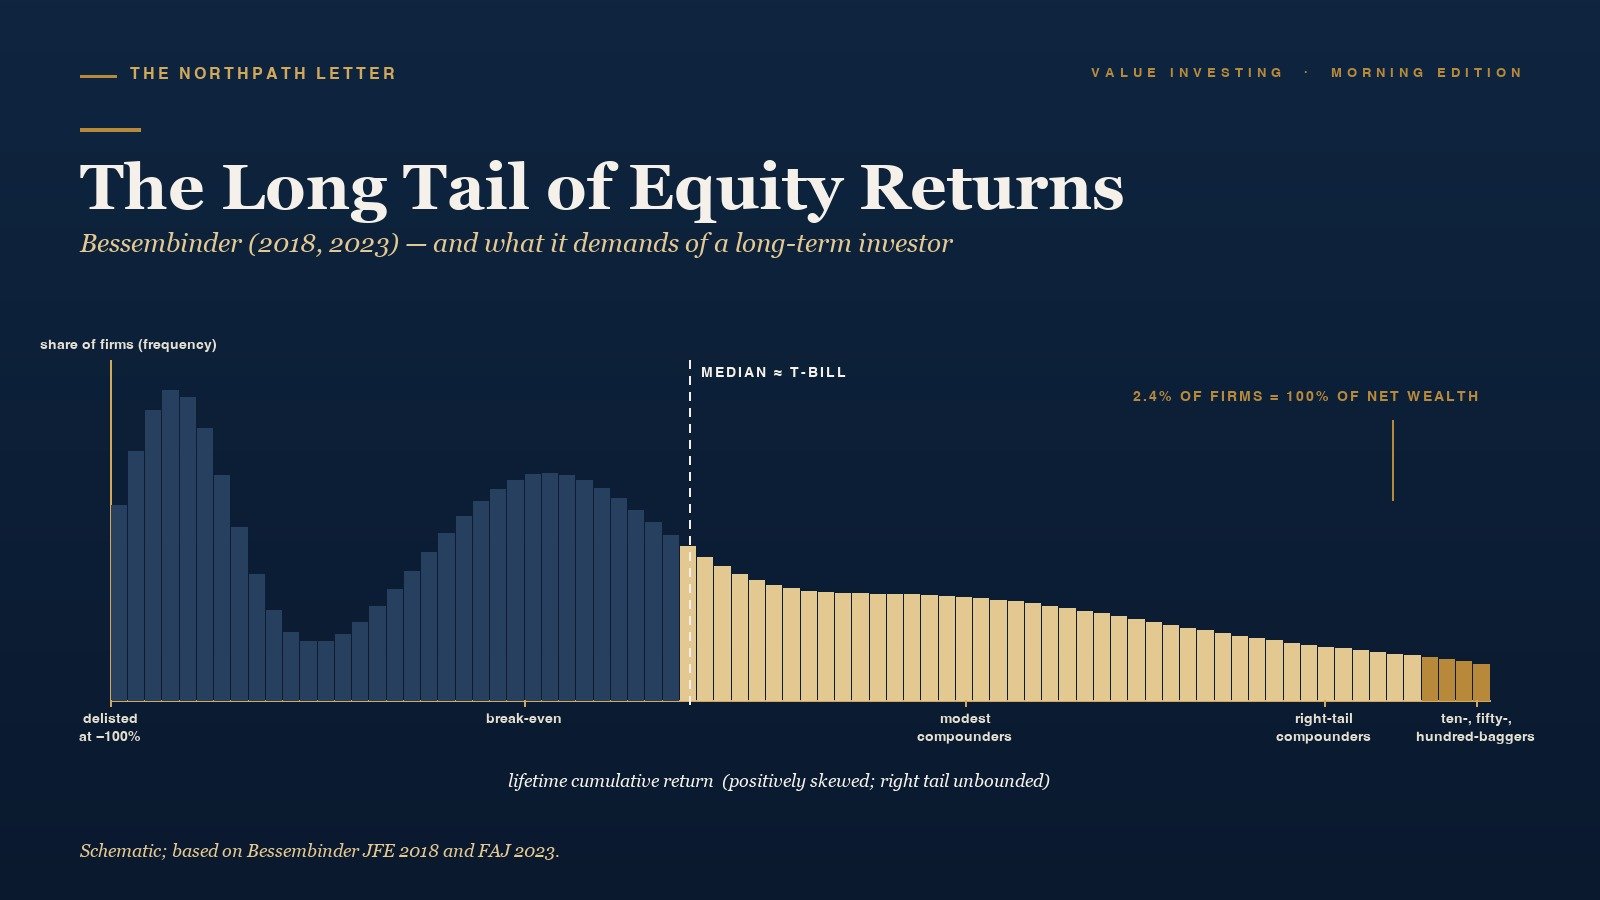
Bessembinder’s principle, reduced to one sentence, is this: the cross-sectional distribution of long-horizon stock returns is so positively skewed that aggregate equity market wealth creation is concentrated in a vanishingly small fraction of firms. The median listed stock, held from listing to delisting, has underperformed a riskless short-dated government bill. The mean stock has comfortably beaten the bill, but only because a tiny right tail of extraordinary compounders has dragged the average upward.

The principle is older than the paper. Maurice Kendall noticed the asymmetry of stock returns in 1953. Eugene Fama wrote about it in 1965. Yakov Amihud, Haim Mendelson, Henrik Hendriksson and Robert Merton, and later Michael Mauboussin in his Counterpoint Global notes, have all returned to it. What Bessembinder did was take the question out of the realm of statistical theory and into the realm of dollars. He counted the wealth.

The translation for a practitioner is uncomfortable. If most stocks lose, then “buy and hold a basket” is not a strategy by itself — the basket matters profoundly. If a few firms built all the wealth, then missing them is not a small cost — it is the cost. And if those firms compounded over multi-decade windows, then the investor’s principal edge is not insight into next quarter’s print but the willingness to remain invested in the right names for far longer than the consensus thinks is reasonable.

2. The Mechanism — Why the Distribution Is Asymmetric

Three structural features of equity ownership produce the long-tailed shape Bessembinder measured.

The first is asymmetric payoff geometry. An equity’s downside is bounded at minus one hundred percent. Its upside is unbounded — a stock that returns one hundred times its purchase price in twenty years is a real outcome that has occurred many thousands of times in market history. When some outcomes are capped at minus one and others are uncapped on the upside, the distribution of compounded outcomes cannot be symmetric. Even if the central tendency of returns were perfectly normal, compounding alone would generate a positively skewed cross-section.

The second is survivorship and self-selection in firm life cycles. Most listed companies do not survive thirty years. They are acquired, delisted, bankrupted, or liquidated. The few that survive long enough to compound for three or four decades are a heavily filtered subset — the survivors are not random. Companies that endure tend to share characteristics (capital-light franchise economics, durable customer demand, disciplined capital allocation, reinvestment opportunities at high incremental returns) that themselves predict further compounding. Survival and compounding feed each other.

The third is winner-take-most economics in product markets. In industry after industry, network effects, scale economics in distribution, and the option value of reinvestment have produced a small number of dominant firms that capture an outsized share of industry profits. The “long tail” in stock returns is, in part, a reflection of the “long tail” in product-market economics. The same handful of firms — Apple, Microsoft, Amazon, Alphabet, Tencent, Samsung Electronics, Taiwan Semiconductor, Nestlé, Roche, LVMH — that dominate the wealth-creation league tables are the same firms whose product-market positions allowed them to reinvest decade after decade at high returns on incremental capital.

The investor’s discipline must be built to fit the shape of the distribution it operates inside. A normal-distribution mindset — “I will own forty stocks, hold them for two years, harvest the average” — collides with the geometry. It is precisely because a few stocks build all the wealth that owning the wrong few is so expensive, and selling the right ones early is the most common form of capital destruction long-term investors inflict on themselves.

Distribution of lifetime stock returns shows fat positive tail.
Figure 1. Schematic of the cross-sectional distribution of lifetime U.S. stock returns, 1926-2016. The median sits below the T-bill benchmark; the long right tail is where aggregate wealth is built.

3. The Empirical Record

The numbers from Bessembinder (2018) are worth committing to memory because they reframe so many practitioner debates at once.

Of the 25,332 common stocks that traded on U.S. exchanges between July 1926 and December 2016, only 42.6 percent generated a lifetime buy-and-hold return that beat holding one-month Treasury bills over the same window. The median stock returned a lifetime cumulative -3.7 percent and was listed for only seven and a half years before being delisted, acquired, or going bankrupt. Of the same universe, 1,092 firms — about 4.3 percent of the total — accounted for all of the roughly $35 trillion of net wealth that listed U.S. equities created above the riskless rate. The other 24,240 stocks collectively contributed zero. The top 86 firms alone (just over one-third of one percent of the universe) generated half of that $35 trillion. The single largest wealth creator over those ninety years was ExxonMobil, followed by Apple, Microsoft, General Electric, IBM, Altria, Walmart, AT&T, Procter & Gamble and Chevron — the names a sceptical investor of 1990 would have called “boring” right up to the moment they realised what compounding could do.

Five years later, Bessembinder, Chen, Choi and Wei (2023) repeated the exercise across 64,394 common stocks in 42 non-U.S. countries plus the U.S. between January 1990 and December 2020. The pattern was not American — it was structural. Across the entire 31-year global sample, 55.2 percent of non-U.S. stocks delivered negative compound returns. Just 2.4 percent of firms accounted for the entire net dollar wealth creation above the one-month U.S. T-bill of roughly $75.7 trillion. The five top global wealth creators were Apple, Microsoft, Amazon, Alphabet, and Tencent. The top non-U.S. names included Samsung Electronics, Taiwan Semiconductor Manufacturing, Tencent, Nestlé, Roche, Novartis, Toyota, LVMH, HSBC, Royal Dutch Shell and AstraZeneca. Concentration of wealth creation in a thin right tail was not a feature of one country, one era, or one regulatory regime. It was a feature of the asset class.

These are not academic curiosities. They are the empirical floor on which the rest of the practitioner conversation about diversification, concentration, and holding periods has to sit.

A particularly underappreciated finding sits inside the 2023 paper. When the authors compute the proportion of net wealth that came from firms outside the United States, the figure for the 1990-2020 window is roughly 42 percent — over $31 trillion of net wealth above U.S. T-bills was created outside the U.S. equity market. The right tail is not an American export. The non-U.S. portion of the right tail is also more concentrated within each country than the U.S. portion is — in Korea a handful of chaebol and Samsung Electronics dominate; in Taiwan, TSMC alone carries an enormous fraction of the country’s wealth creation; in Switzerland, Nestlé, Roche and Novartis between them account for the majority of national equity wealth. Country-level concentration of the right tail is a real, repeated, and structural feature of the global cross-section.

4. Two Historical Episodes

The first episode is Japan, 1990 to 2024. The Nikkei 225 peaked on 29 December 1989 at 38,915 and did not durably regain that level until early 2024 — a generational drawdown of thirty-four years. To the index-level observer, Japanese equities were a graveyard. To the cross-sectional observer, Japan was a beautifully clean example of Bessembinder’s long tail. Inside that thirty-four-year flatline, Keyence compounded at roughly 19 percent annually in yen terms; Fast Retailing (Uniqlo’s parent) compounded comparably; Nintendo, Shin-Etsu Chemical, Hoya, Daikin, and Sysmex compounded across the same window. The index aggregated zero because the long left tail of bank, real-estate and zombie-industrial stocks offset the right-tail compounders almost exactly. An investor who owned the Nikkei flatlined for a generation; an investor who owned a concentrated set of the right-tail Japanese firms compounded as well as anyone in the world.

The second episode is the pandemic dislocation of 2020 to 2022. Between February 2020 and October 2022 the MSCI All-Country World Index traded sideways in dollar terms — a few percent up, a deep drawdown in 2022, recovery thereafter. The aggregate told one story. The cross-section told another. ASML, Taiwan Semiconductor, Tencent (for the first half of the window), Microsoft, Apple, Amazon, Alphabet, Eli Lilly, LVMH and Hermès compounded heavily through the dislocation; cruise lines, legacy airlines, fossil-fuel-only utilities, and a long roster of legacy retailers and media businesses went sideways or shrank. Once again the index was the algebraic sum of a long left tail and a thin right tail — and an investor’s experience depended entirely on which side of the distribution they had positioned themselves on.

Two episodes, three continents, thirty years apart, the same shape. The long tail is not a U.S. phenomenon, not a tech phenomenon, not a bull-market phenomenon. It is a feature of the asset class, visible in every well-measured window of any reasonable length.

Top global wealth-creating stocks of 1990-2020.
Figure 2. The top wealth-creating firms in the 2023 global Bessembinder dataset, 1990-2020. Five U.S. firms and a thin global complement carried the right tail.

5. The Application Framework — Three Disciplines

The long-tail finding does not licence indiscriminate concentration, and it certainly does not licence the “find the next Apple” speculation that pollutes the popular literature. What it does is reframe three concrete practitioner disciplines.

Discipline one — hold the right tail with both hands. The most common error a long-term investor makes is selling a position that has begun to compound at high incremental returns on capital. Trimming “because it’s gotten too big in the portfolio” is, in Bessembinder’s arithmetic, the precise act of clipping the right tail that builds aggregate wealth. The discipline is not to refuse to ever sell — it is to require an explicit, written, falsifiable thesis for why the underlying franchise economics have deteriorated before reducing a position that the market is willing to reward. Position-size drift caused by compounding is not a problem to be corrected; it is the outcome the strategy was designed to produce.

Discipline two — diversify on the left, concentrate on the right. Bessembinder’s data do not say “own one stock.” They say that the right tail is irreducibly hard to identify ex ante, that the left tail is real and ruinous, and that the rational practitioner therefore wants enough names in the portfolio that any single left-tail outcome does not break compounding, while also being willing to let the right-tail names grow without artificial caps. In practice this often resolves to a portfolio of fifteen to twenty-five carefully chosen long-duration franchises, with the strongest five or six allowed to drift to twenty, thirty, or forty percent of capital over a multi-decade holding period.

Discipline three — extend the holding period until the right tail can express itself. Bessembinder’s wealth-creation calculations are computed over the full listed life of each stock. They cannot be reproduced in a one-year, three-year, or even five-year window. The right tail in his data took a median of two to three decades to fully express itself. An investor whose typical holding period is eighteen months is functionally invisible to the long-tail engine — they are trading inside a window too short for the geometry to matter. Extending the typical holding period from two years to ten years is, in long-tail terms, more important than any improvement in stock-selection accuracy at the front end. This is the principle Michael Mauboussin has elsewhere called “time arbitrage” — the structural edge of a holder who can wait when most market participants cannot.

6. How Practitioners Have Applied It

Three named practitioners have built portfolios whose discipline maps closely onto Bessembinder’s empirical regularity.

Charlie Munger wrote and spoke for fifty years about the same observation, well before Bessembinder formalised it. In his 1995 Harvard speech on the psychology of human misjudgment, and across the annual meetings of Daily Journal and Berkshire from 1995 to 2023, Munger returned again and again to the same theme: the rational long-term portfolio is the one that owns a small number of “wonderful businesses” and holds them across decades. His personal portfolio at death held three names. Berkshire Hathaway’s listed equity book, at its peak post-2010 concentration, had roughly 40 percent of its weight in a single name (Apple) and over 70 percent in its top five positions. Munger’s repeated answer to the question of why he diversified so little was direct: because the right tail is where the compounding lives, and refusing to let it run is what most professional investors do wrong.

Nick Sleep and Qais Zakaria ran the Nomad Investment Partnership from 2001 to 2014 with an explicit doctrine that closely anticipated Bessembinder. In the Nomad letters (collected and published in 2021), Sleep wrote repeatedly about “scale economies shared” — the small set of companies that pass operating leverage back to customers as lower prices and so widen their moat over decades. Nomad’s portfolio at closure in 2014 consisted of three positions: Amazon, Costco, and Berkshire Hathaway. Each had been held for many years; each was deeply researched at the franchise-economics level; each was sized to a level that would have made a conventional risk officer protest. Nomad returned its investors approximately twentyfold over thirteen years before voluntarily winding down. The structure of the result was Bessembinder’s distribution as a portfolio policy.

Tom Russo at Gardner Russo & Quinn has run the Semper Vic Partners and Global Family Branded Equity funds along similar lines since the late 1980s. His top ten holdings have for decades represented roughly two-thirds of the fund’s assets — Nestlé, Heineken, Pernod Ricard, Brown-Forman, Mastercard, Berkshire Hathaway, and a small set of other multi-decade brand franchises. Russo’s central concept, which he calls the “capacity to suffer,” is the discipline of accepting reported-earnings drag from long-cycle reinvestment by management teams who are building thirty-year businesses. The discipline maps directly onto Bessembinder: the firms that built the right tail were almost never the most reported-earnings-efficient firms in any single year. They were the firms whose owners let them reinvest, year after year, at high returns on incremental capital, and stayed in the seat long enough for the geometry to compound.

Three other practitioners are worth naming in passing because their portfolios have been built around the same shape of distribution. Terry Smith at Fundsmith Equity has run a portfolio of roughly twenty-five to thirty long-duration consumer and software franchises since 2010, with the explicit doctrine “do nothing” once the franchises are owned. Chuck Akre at Akre Capital Management built the Akre Focus Fund around a three-legged stool of business quality, capable management, and reinvestment runway — and let the strongest names (Mastercard, Visa, American Tower, Moody’s) compound to thirty and forty percent weightings in the portfolio over more than a decade. Christopher Hohn at TCI Fund Management runs a deeply concentrated long-duration book that has at times held just eight to ten positions. In every case, the portfolio architecture is recognisable as a deliberate attempt to ride the right tail of the distribution rather than to average it away.

Practitioner portfolios reflect the long-tail discipline.
Figure 3. Three practitioner portfolios shaped by the long-tail principle — Munger’s Daily Journal book, Sleep & Zakaria’s Nomad, and Russo’s Semper Vic — each holding a small set of long-duration franchises.

7. Key Takeaways

First, the equity return distribution is not normal. It is positively skewed at the security level and the asymmetry strengthens as the holding period lengthens. Aggregate market wealth is built in a thin right tail, in any country and any era so far measured.

Second, the median stock loses to the riskless rate over its listed life. The mean stock wins only because of the right tail. An investor who diversifies broadly without holding the right tail is, in expectation, owning the middle of the distribution — which is where wealth is not created.

Third, the practitioner response is not “buy the index and look away” — that is a structurally sound but emotionally easier path. The active practitioner response is to own a small set of carefully chosen long-duration franchises, accept that the position weights of the right tail will drift upward as the strategy succeeds, and extend the holding period far beyond what conventional turnover statistics imply.

Fourth, identifying the right tail in advance is irreducibly hard. The discipline is therefore to put the weight of the work into franchise quality, capital allocation discipline, and management durability — the structural predictors of the right tail — and to accept that even a careful process will miss most of the future winners. The point is not to own all of them. The point is to own enough of them, large enough, for long enough, that the geometry can do its work.

Fifth, the time horizon is the single most underused free variable in the long-term investor’s toolkit. Bessembinder’s calculations are denominated in lifetimes. An investor whose effective holding period is two years cannot, by construction, harvest a phenomenon that takes two to three decades to express itself. Extending the holding period is not a stylistic preference. It is the precondition for the long-tail engine to operate inside one’s own portfolio.

— Manish Goel, FCA / NorthPath Advisory OÜ / Tallinn, Estonia

Important.
All content on this site and in this email is journalism and education for a general audience. Nothing here constitutes investment advice or a recommendation in respect of any specific financial instrument, nor an offer or solicitation to buy or sell any security. Readers should consult an authorised financial adviser regulated in their own jurisdiction before making any investment decision.