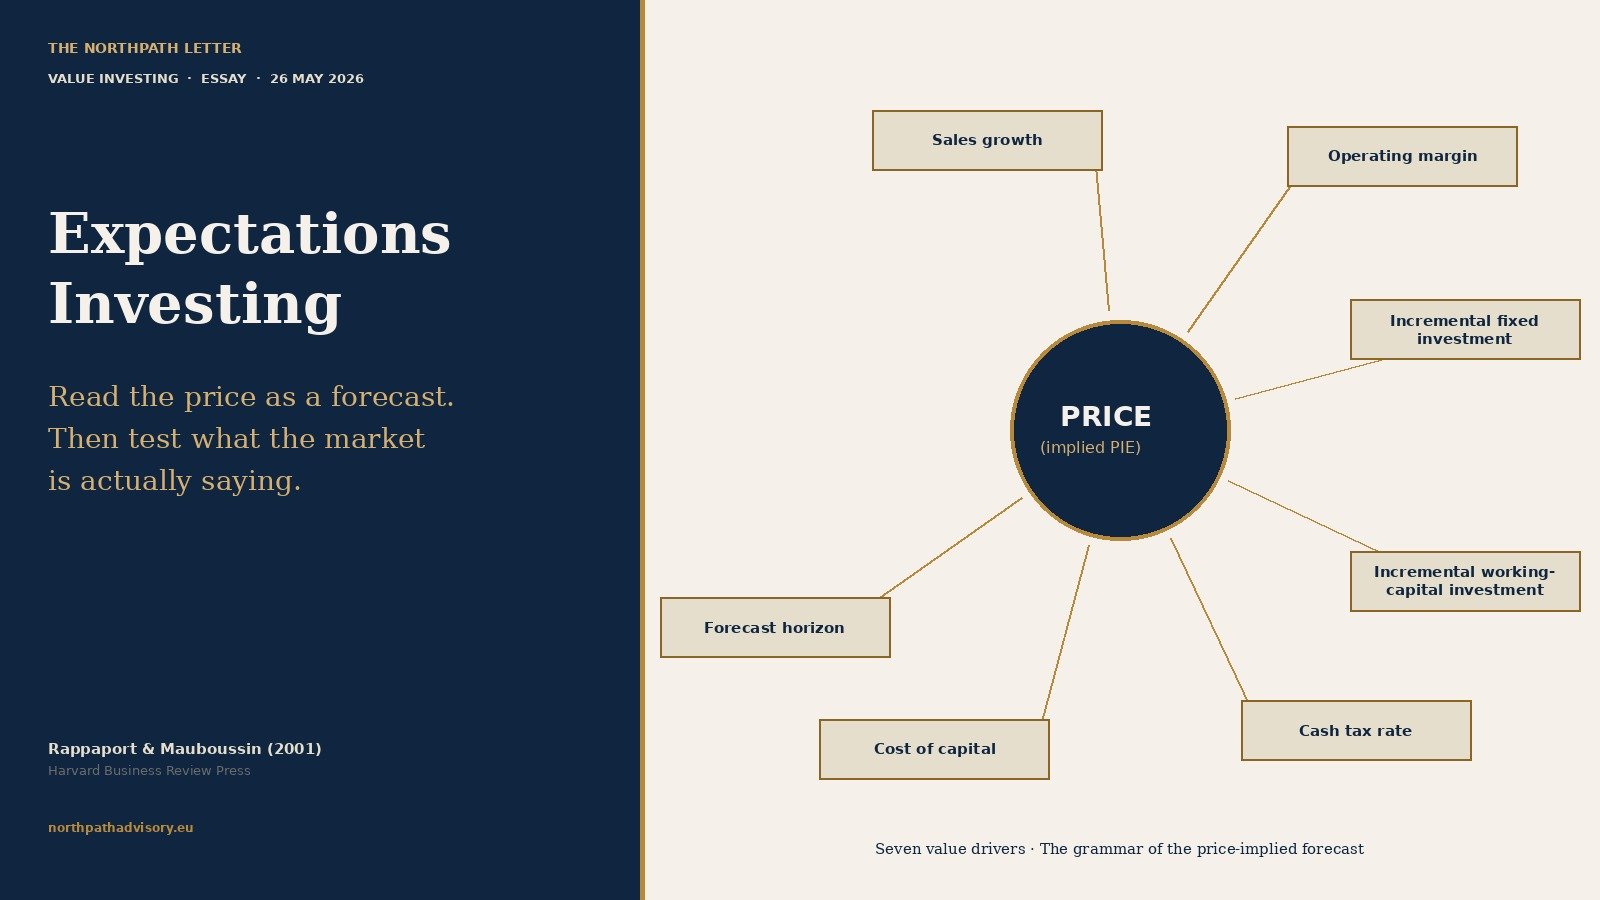
Expectations Investing: How Alfred Rappaport and Michael Mauboussin’s 2001 Framework Asks the Long-Term Investor to Read the Price as a Forecast

valueinv cover expectations investing rappaport mauboussin 2001

The NorthPath Letter · Value Investing · Morning Edition · 26 May 2026

Every quoted stock is a sentence the market is whispering to you, in a language most investors never bother to translate. The number on the ticker is not an answer. It is a forecast — a discounted stream of expected future cash flows that the marginal buyer and seller have, between them, agreed to. The disciplined long-term equity investor’s first task is not to build their own forecast and argue with the price, but to read the price as a forecast, decompose it into its operating assumptions, and ask one quiet question: are those assumptions achievable, conservative, or heroic? That inversion of the conventional analytical reflex — start from price, work backward to operating drivers, then test — is the heart of the framework Alfred Rappaport and Michael Mauboussin set out in their 2001 book Expectations Investing. Twenty-five years on, in a market saturated with macro narrative and quarter-by-quarter melodrama, the framework has lost none of its discipline and very little of its edge.

1. The principle: read the price, then test it

Most equity research, even today, follows a familiar choreography. The analyst projects revenue, margins, and capital intensity over a five- to ten-year horizon, discounts the resulting free cash flows to a present value at a chosen weighted average cost of capital, compares that value with the prevailing market price, and renders a verdict. Buy if intrinsic value exceeds price; sell or avoid otherwise. The procedure has the comforting appearance of rigour. In practice, it is almost always defeated by the single weakness it cannot acknowledge: the forecast that anchors it is the analyst’s, and the analyst has no demonstrable edge in forecasting.

Rappaport and Mauboussin’s framework reverses every step. The market price is taken as given, not contested. The analytical work is to derive — by algebra — the specific combination of sales growth, operating margin, incremental investment rate, tax rate, cost of capital, and forecast horizon that would justify that price exactly. This combination is called the price-implied expectations, or PIE.

The investor’s edge, on this view, comes from being a better judge of whether the PIE is realistic than the marginal market participant. The work shifts from forecasting (a skill in which most investors have no demonstrable edge) to forensic interrogation of consensus assumptions (where a patient, primary-source investigator can develop one). Rappaport and Mauboussin trace the intellectual lineage of this idea to Alfred Rappaport’s earlier work on shareholder value (Rappaport, Creating Shareholder Value, 1986), which articulated the seven value drivers that any discounted cash-flow model rests on. The 2001 book made those drivers the language in which the implied forecast is decoded. The 2021 revised edition, published by Columbia Business School Publishing, updated the worked examples for the post-2008 environment of compressed discount rates and intangible-heavy balance sheets without altering the procedural spine.

Seven Rappaport value drivers donut chart
Figure 1. The seven value drivers — the grammar in which every market price implicitly speaks.

2. The mechanism: why surprises, not levels, drive returns

The empirical regularity that gives expectations investing its purchase is straightforward. Over short and intermediate horizons, a stock’s return is dominated not by how the company performs in absolute terms, but by how its performance compares with what was already priced in.

A business growing revenues at twelve per cent a year is a good business. If the market had been pricing in fifteen per cent, the stock will fall on a quarter that delivers twelve. A business growing at six per cent is a mediocre business. If the market had been pricing in three, the stock will rise on a quarter that delivers six. The level of performance is not the operative variable. The change in expectations is.

This is why Mauboussin, in a series of papers written first at Credit Suisse and later at Counterpoint Global, returns again and again to a single metric — what he calls the expectations infrastructure: the small set of operating drivers (volume, price, mix, operating leverage, returns on incremental capital) that explain almost all of the change in market-implied free cash flow. If those drivers move favourably relative to expectations, the stock works. If they move unfavourably, even good absolute performance is insufficient. The pattern holds across geographies and across decades. Studies of US, European, Japanese and emerging-market equity returns since the 1980s consistently show that earnings surprises explain more of the cross-sectional variation in twelve-month forward returns than do absolute earnings growth rates.

For the long-term equity investor, the implication is liberating rather than constraining. Most short-term noise is the marginal participant repricing their expectations on a single quarter of news. The investor who has already done the work of decomposing the PIE and forming an independent view of where each driver will land over five to ten years is not buffeted by that repricing. They are, in many cases, on the other side of it.

3. The empirical record: anchoring, drift, and the inadequacy of multiples

The case for expectations investing rests on three documented regularities, each of which has been replicated in the academic literature across multiple decades and multiple markets.

The first is anchoring. Lichtenstein, Slovic, Fischhoff and Phillips, in their 1982 review in Kahneman, Slovic and Tversky’s Judgment under Uncertainty, showed that human forecasters anchor on the most salient prior estimate. In equity markets, that prior is almost always last quarter’s reported number or consensus estimate. Analyst forecasts cluster within narrow bands around prior outcomes (Easterwood and Nutt, 1999; Cen, Hilary and Wei, 2013). The marginal market participant is, statistically, the analyst — and the analyst is anchored. A disciplined PIE decomposition gives the investor a chance to spot expectations that the consensus has accepted simply because they sit close to the recent past.

The second is post-earnings-announcement drift, first documented by Ball and Brown in 1968, replicated across five decades and almost every major market, and surveyed comprehensively by Bernard and Thomas (1989). Stocks that surprise consensus to the upside continue drifting upward for sixty trading days; stocks that surprise to the downside continue drifting downward. The mechanism is the slow updating of expectations: the marginal market participant takes weeks, not minutes, to reformulate their model. The disciplined PIE investor, who already holds a more accurate view of operating drivers, can position before the drift compounds.

The third is the documented inadequacy of price-to-earnings multiples as a stand-alone valuation tool. A trailing P/E of twelve can be cheap (if the company is in a stable industry with twelve per cent return on incremental capital and no growth) or expensive (if the company faces structural decline). A P/E of forty can be expensive (if growth is decelerating) or cheap (if growth is accelerating and incremental returns on capital are high). Mauboussin’s 2014 Credit Suisse note What Does a Price-Earnings Multiple Mean? demonstrates algebraically that the P/E ratio is itself a compressed statement of price-implied expectations — and that comparing P/Es across companies without unpacking those expectations is meaningless. Expectations investing forces the investor to do the unpacking explicitly.

To these three regularities one might add a fourth, drawn from the Bessembinder long-tail literature that has now been replicated through 2023: a small minority of stocks account for nearly all aggregate equity wealth creation, and those stocks are characteristically ones where the price-implied expectations at the start of the holding period were materially below the realised trajectory. Expectations investing is the procedural counterpart of the long-tail empirical fact: it is the method by which an investor positions for the asymmetric outcome rather than the average one.

4. Two historical episodes where the principle was visible

The Cisco Systems episode of March 2000 is the textbook illustration. At the peak, Cisco traded at a market capitalisation of approximately five hundred and fifty billion United States dollars, with consensus implying revenue growth of more than thirty per cent annually compounded for the following decade. A PIE decomposition by an analyst willing to do the arithmetic would have shown that, even granting generous operating margins, Cisco would need to be capturing essentially all of the global enterprise networking spend by 2010 to justify the price. The required share-of-spend was not achievable; the price was, in the Rappaport-Mauboussin sense, pricing a heroic outcome. Over the following two and a half years, the stock fell by approximately eighty-eight per cent, even as the business itself continued to grow revenue and protect margin. The fall was not a business failure. It was an expectations realignment — and a realignment that was visible in the arithmetic at the peak, to anyone willing to look.

The opposing example is Amazon in late 2001 and through 2002. At points during the post-dot-com winter, Amazon’s market capitalisation implied that operating margins would never expand above one or two per cent, that revenue growth would taper to single digits within five years, and that the company’s investment in fulfilment infrastructure would never earn an adequate return. A PIE decomposition done in 2002 — using Rappaport and Mauboussin’s framework explicitly — would have revealed that the marginal investor was extrapolating short-term losses into permanent unprofitability. Bill Miller, then managing Legg Mason Value Trust and a notable practitioner of expectations-investing language, built a position on exactly that logic. The five-year return on that position exceeded six hundred per cent — not because the business surprised on an absolute basis, but because operating margins and capital efficiency surprised relative to the bombed-out implied trajectory.

A third compact illustration, drawn from the European market, is the Anheuser-Busch InBev sequence from 2018 to 2020, when the brewer’s price implied permanent revenue stagnation and balance-sheet stress; subsequent margin recovery and methodical deleveraging surprised that implied trajectory positively, and the stock recovered roughly seventy per cent from its 2020 lows over the following twenty-four months. The same arithmetic, applied across continents and decades, identifies the same kind of opportunity: a price that has compressed expectations below what the operating reality can deliver.

Expectations gap diptych — Cisco March 2000 and Amazon late 2002
Figure 2. Two episodes in which the arithmetic disagreed with the marginal market participant.

5. The application framework: three concrete disciplines

The temptation, when introduced to expectations investing, is to treat it as a mental attitude — a sensibility, a way of thinking. It is, in fact, a procedural discipline that can be written down and followed by anyone willing to maintain a working spreadsheet and a primary-source library.

First, decompose the price into a PIE. The investor begins with the market capitalisation plus net debt — enterprise value. From this, they subtract the present value of the next several years of consensus or analyst-built free cash flow forecasts, then solve algebraically for the residual: the long-term growth rate, the terminal margin, or the value-growth duration that would close the gap. Practical implementations require a discounted cash flow spreadsheet with the seven Rappaport drivers (sales growth, operating margin, incremental fixed investment rate, incremental working-capital investment rate, cash tax rate, weighted average cost of capital, and competitive-advantage period or forecast horizon) as adjustable inputs. The investor varies one driver at a time, holding the others at base-case values, and notes the level at which the price is exactly justified. The output is a small table: “the price assumes ten per cent sales growth for fifteen years, OR twelve per cent operating margin in steady state, OR forty per cent return on incremental capital.” Three sentences, derived from arithmetic, that pin down what the market is actually saying.

Second, test each PIE assumption against the operating evidence. This is where Fisher-style scuttlebutt, regulatory filings, capital-cycle data, and primary-source competitor analysis re-enter. If the PIE requires fifteen years of fifteen per cent sales growth, the investor asks: what is the addressable industry growth rate, what share would the company need to gain, what is the historical maximum share for any single competitor in this category, and what would have to be true at the customer or product level for that share-gain to materialise? If the PIE requires twelve per cent operating margins permanently, the investor compares against the highest margin ever achieved in the industry, the margin trajectory of comparable businesses across cycles, and the structural reasons margins might be defensible against the entry of new capacity. The discipline is not to forecast better. It is to test whether the consensus forecast embedded in the price is achievable, conservative, or aggressive.

Third, identify the catalysts that would cause the PIE to revise. Stocks rerate when one or more of the seven value drivers moves materially relative to expectations. The disciplined investor pre-specifies which observable events — a regulatory approval, a competitor exit, a price move, a capital-cycle inflection, a balance-sheet repair — would cause each driver to revise upward or downward, and in roughly what magnitude. They then monitor those specific events rather than the daily price. Position sizing follows from how asymmetric the catalyst set is: if the realistic distribution of revised PIE outcomes is heavily skewed upward, the position is sized larger; if symmetric or skewed downward, smaller or not taken at all.

These three disciplines — decompose, test, monitor — turn a vague philosophical preference for “the market is wrong” into a procedure that can be applied consistently across hundreds of names over decades. That repeatability is what separates a framework from an opinion, and it is what allows the practitioner to keep working through periods of personal doubt and market turbulence without abandoning the method.

Three procedural disciplines: decompose, test, monitor
Figure 3. The three procedural disciplines — repeatable across names, quarters, and decades.

6. How long-term-equity practitioners actually applied it

Bill Miller, while running Legg Mason Value Trust between 1991 and 2005, beat the S&P 500 for fifteen consecutive years — a record without precedent in publicly tracked mutual fund history, and one that has not been equalled since. Miller’s process, as documented in Janet Lowe’s The Man Who Beats the S&P (2002) and in Miller’s own quarterly letters, was an explicit application of expectations investing. Miller would identify stocks where, by his arithmetic, the price-implied expectations were materially lower than the realistic trajectory, and hold them through the painful repricing window that follows the catalyst. His Amazon position, his AOL position, and his Dell position in the early 1990s were all built on PIE decomposition rather than absolute-valuation work. Miller wrote and spoke about Mauboussin’s and Rappaport’s framework explicitly through the 1990s and 2000s, often citing the 2001 book by name.

Howard Marks, in his memo “Risk” of January 2006 and in his book The Most Important Thing (2011), discusses the same arithmetic in different language. Marks emphasises that an investor’s return is determined not by what they buy but by what they pay relative to what was expected — and that the price embeds the expectations. Marks’s preference for second-level thinking is, structurally, expectations investing: ask not what the company will do, but what the company will do versus what the market thinks it will do. Marks has returned to this point in memos across two decades, including his 2018 piece on the limits of macro forecasting, and his 2022 memo on the sea change in interest rates, where he framed the rate environment itself as a shift in the implied discount rate baked into every equity price.

Warren Buffett, in the 1992 Berkshire Hathaway letter, sets out what is in substance an expectations decomposition. Discussing the question of whether a stock is dear or cheap, Buffett writes that the only honest test is to compute the discount rate that, applied to the stream of cash the business will produce over its life, equates the present value of those cash flows to today’s price. That discount rate is the rate of return the market price implies. If the investor believes the cash flows will be higher or arrive sooner than the market is pricing, the implied return overstates the achievable return; if lower or later, it understates. The investor’s task is the comparison.

Michael Mauboussin, in his Counterpoint Global notes since 2020, has continued to argue that expectations investing is the only framework that survives contact with empirical asset-pricing data. His 2014 note What Does a Price-Earnings Multiple Mean? decomposes the P/E into its expectations components and shows that almost all the cross-sectional variation in P/E across firms is explained by differences in implied growth and incremental returns on capital, not by differences in “quality” or “story” in any vaguer sense. His more recent work on intangible-heavy businesses applies the same arithmetic to the question of how to capitalise research, development and customer-acquisition expenditure when reading the price of a software or platform business.

These four practitioners — Miller, Marks, Buffett, Mauboussin — converge on the same procedural insight from very different starting points. The convergence is what gives the framework its weight. Each of them, in different vocabularies, is doing the same thing: refusing to argue with the price until they have first decoded what the price is saying.

7. Key Takeaways

The market price of a quoted equity is an embedded forecast, and the long-term investor’s first task is to translate it into specific operating assumptions before having an opinion on whether the stock is dear or cheap.

Stocks rerate on changes in expectations, not on absolute performance levels; the investor who has already decomposed the price-implied expectations is structurally positioned to be on the right side of those changes.

Decomposing a price requires arithmetic, not insight: a discounted cash flow model with the seven Rappaport value drivers, varied one at a time, will reveal what the market is actually saying. The insight comes in the next step — testing those assumptions against the operating evidence.

The discipline replaces forecasting (where most investors have no edge) with the forensic interrogation of consensus (where a patient primary-source investor can develop one); this is the only edge that compounds reliably over decades.

Expectations investing is not contrarian by temperament. It is contrarian by accident, when the arithmetic happens to disagree with the marginal market participant. The investor’s loyalty is to the arithmetic, not to the contrarian posture — and over time, that loyalty is what produces the asymmetry of outcomes the Bessembinder long-tail data so vividly describe.

— Manish Goel, FCA / NorthPath Advisory OÜ / Tallinn, Estonia

Important.
All content on this site and in this email is journalism and education for a general audience. Nothing here constitutes investment advice or a recommendation in respect of any specific financial instrument, nor an offer or solicitation to buy or sell any security. Readers should consult an authorised financial adviser regulated in their own jurisdiction before making any investment decision.