The NorthPath Letter · Behavioural Finance · Afternoon Edition
In 1894, in Following the Equator, Mark Twain wrote a sentence that a hundred and seven years later would become the title of an academic paper in Organization Science. “We should be careful to get out of an experience only the wisdom that is in it — and stop there; lest we be like the cat that sits down on a hot stove-lid. She will never sit down on a hot stove-lid again — and that is well; but also she will never sit down on a cold one any more.” Twain was making a literary observation. Jerker Denrell and James G. March, writing in 2001, turned it into a formal model of how an adaptive learner, sampling outcomes from a set of options whose true qualities are uncertain, can converge on a stable and systematically wrong belief about the world.
The argument is the single most important diagnostic any long-term equity investor can carry through a career, because it explains, more cleanly than any other behavioural construct, why the categories that an investor has been most recently burned by are precisely the categories the investor is most likely to misprice for the next decade. It is not a story about emotion. It is a story about information. And once the mechanism is understood, the discipline of counter-measure becomes a deliberate operational protocol rather than a feat of psychological self-overcoming.
The bias, defined
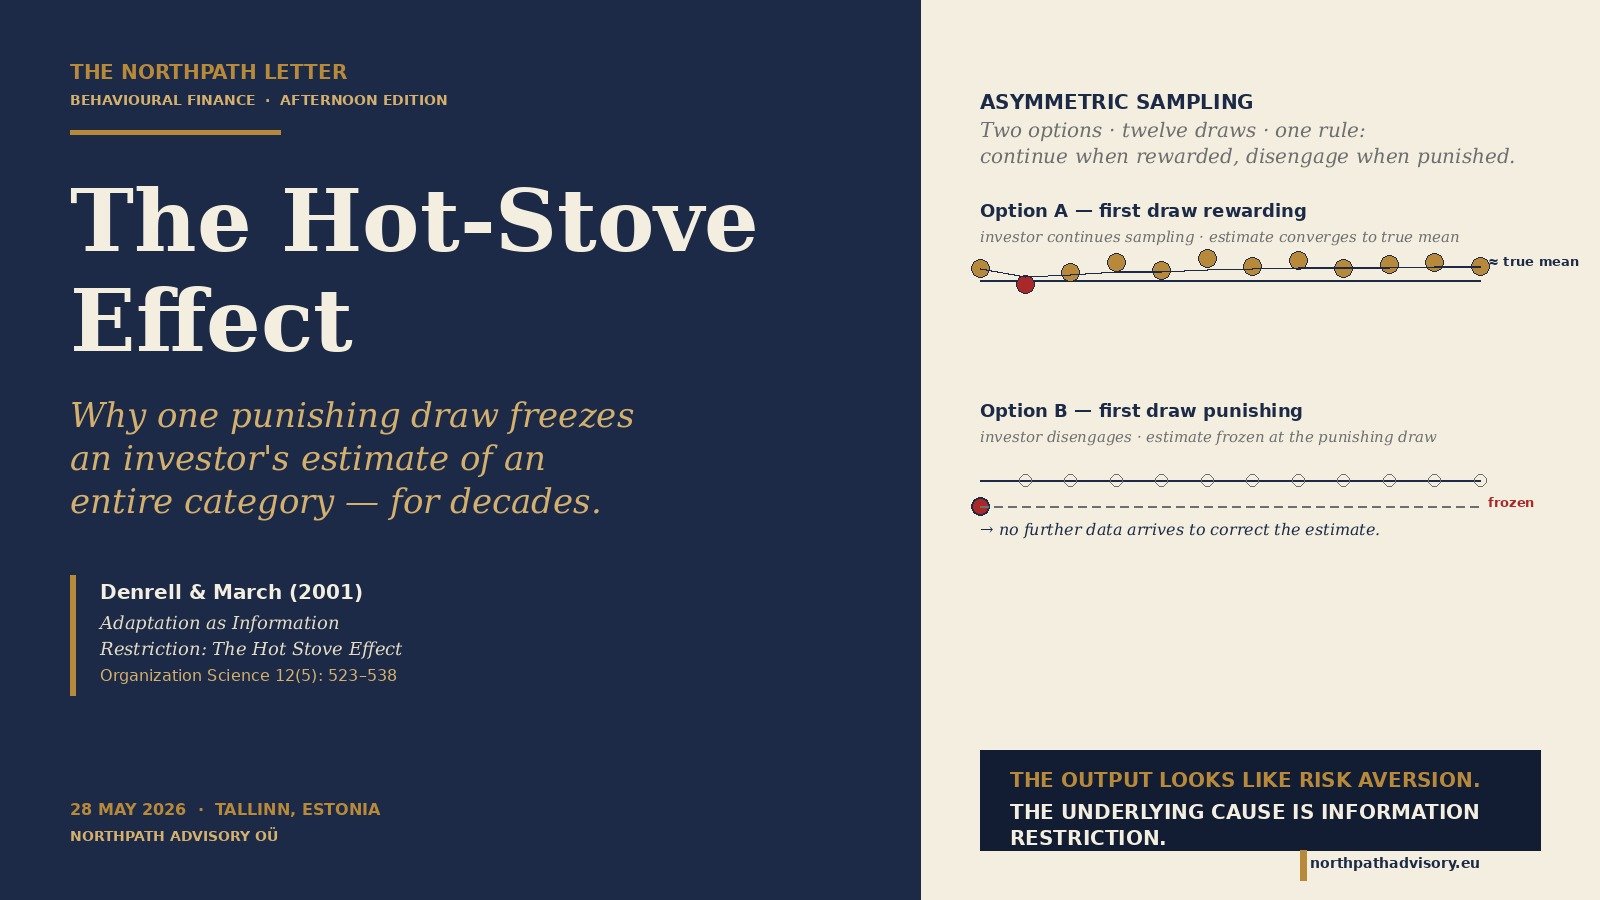
The hot-stove effect, as formalised by Denrell and March in “Adaptation as Information Restriction: The Hot Stove Effect” (Organization Science 12(5), 2001, pp. 523-538), is the proposition that adaptive learning — the simple rule of returning to options that have rewarded you and avoiding options that have punished you — produces, in the presence of any noise in outcomes, a systematic and permanent under-estimate of the quality of risky and novel alternatives. The mathematics is elementary. The implication is severe. An option’s estimated value, in the mind of an adaptive learner, is the running average of the outcomes the learner has sampled from it. The learner’s sampling rule is to continue drawing from options whose running average is high and to stop drawing from options whose running average is low. The crucial observation is that the running average for any high-variance option will, sooner or later, dip below the threshold — not because the true mean of the option is low, but because the realised draws from a noisy distribution will occasionally include a string of bad outcomes. Once the running average dips below the threshold, the learner stops sampling. The estimate is then frozen at the punishing value forever. No further data arrives to correct it.
Denrell extended the construction in “Adaptive Learning and Risk Taking” (Psychological Review 114(1), 2007, pp. 177-187), showing that the same mechanism produces an apparent and durable preference for low-variance options over high-variance options of equal true mean — without invoking any utility-curvature explanation. The agent in the model is not risk-averse in the Bernoulli sense. The agent is simply a sampler whose sampling has been truncated by its own past actions. The output looks like risk aversion. The underlying cause is information restriction.
The mechanism
It is worth pausing on the asymmetry, because the asymmetry is the entire phenomenon. Consider an option whose true expected return is positive but whose realised returns include a left tail of painful losses. An investor allocates a starter position. The first draw is one of the left-tail outcomes. The investor’s estimate of the option’s quality is now anchored on a deeply negative number. The investor’s decision rule — one that no professional would find unreasonable, because it is the rule by which prudent capital is supposed to be allocated — is to reduce or eliminate exposure to options that have disappointed. The investor disengages. Crucially, the investor’s disengagement is not a temporary suspension. It is the silent termination of all future data collection on that option. Every subsequent outcome that the option would have produced — including the right-tail outcomes that would have corrected the estimate — never enters the investor’s record at all. The estimate is locked at the punishing draw forever, and the investor will defend the lock with the entirely sincere argument that the data, such as it is, supports the decision.
Compare this with the corresponding case of an option whose first draw happens to be a right-tail outcome. The investor adds to the position, samples more data, and the running average regresses to the true mean. The bias is not symmetric, because the sampling rule is not symmetric. Continued engagement provides more information; disengagement provides none. Across the full universe of options the investor considers, those that delivered a punishing first draw become permanently and systematically under-estimated. Those that delivered a rewarding first draw converge to their true means. The investor’s portfolio — and the investor’s expressed preferences for what to consider in future — is the equilibrium of this asymmetric learning. It is a portfolio shaped not by the world as it is, but by the world as the investor stopped looking at it.
The further implication, drawn out by Denrell across both papers, is that the bias is heavier where outcome variance is heavier. Low-variance options — bonds, money-market instruments, defensive consumer staples held over very long periods — produce running averages close to their true means after very few draws, and the investor’s estimate is reasonably well-calibrated. High-variance options — cyclical equity, deep value, emerging markets, smaller-capitalisation securities, recovering sectors after a credit event — produce running averages whose first few draws can be far from the true mean, and these are precisely the categories most likely to be discarded after a single bad season and never re-sampled. The hot-stove effect is, in this sense, a structural reason why an entire class of investors will under-own precisely the categories that academic finance suggests offer the deepest long-horizon premia. It is not a story about courage. It is a story about who stops counting and when.

The empirical record
The cleanest large-sample evidence comes from regulators who have, in the years since the global financial crisis, methodically measured how retail households allocate when they have the resources to invest but the experience to remember being burned. The United Kingdom’s Financial Conduct Authority Financial Lives 2024 Survey, conducted between February and June 2024 with 17,950 respondents, documents that sixty-one per cent of adults with more than ten thousand pounds in investible assets hold at least three-quarters of those assets in cash rather than in any form of invested instrument. The same survey records that twenty-four per cent of all United Kingdom adults — some 13.1 million people — had low financial resilience as of May 2024. The FCA reports the headline in the language of cash hoarding and product hesitation. The hot-stove reading is sharper: a cohort of households, having lived through the 2008 financial crisis, the 2011 European sovereign episode, the 2020 pandemic drawdown and the 2022 gilt convulsion, has effectively withdrawn from the equity sampling exercise altogether. Their estimate of the long-horizon premium is locked at whatever the worst of those episodes told them. The locked estimate has not been corrected by the 2009-2021 equity recovery for the simple reason that they were not in the market to receive it.
The complementary anchor is the United States Federal Reserve’s Survey of Consumer Finances, whose 1989-2022 triennial waves provide the longest comparable cross-section of household balance sheets in the world. The 2022 wave, published in October 2023, records that the equity participation rate among households headed by adults under thirty-five recovered only gradually after the 2008 crisis: in 2010 the participation rate for that cohort stood near a multi-decade low, and although the 2022 wave shows a meaningful rebound — with twenty-two per cent of Millennial and older-Gen-Z households reporting direct stock ownership and a further nine per cent holding pooled funds — this recovery took fourteen years, during which the broad United States equity market roughly quadrupled on a total-return basis. A generation of households, hot-stoved by the 2008 draw, were absent for most of the right-tail draws that followed. The cost of that absence, measured in lifetime wealth, is the most expensive consequence of a single bias in the long history of household finance.

Two historical episodes
Japan, 1989 to 2020. The Nikkei 225 peaked at 38,915.87 on the final trading day of December 1989. Over the next two decades and a half, the index drifted, crashed, briefly recovered, crashed again and stayed below the 1989 high until 22 February 2024 — a period of more than thirty-four years. The behavioural consequence for Japanese households was the closest pure-form expression of the hot-stove effect ever recorded. Bank of Japan Flow of Funds data show that household financial assets shifted decisively into cash and cash-equivalents from 1990 onward: by 2010 roughly fifty-four per cent of household financial assets were held as cash and bank deposits, against approximately ten per cent in equity and investment trusts combined, a ratio that did not materially shift until the long-running Suga-Kishida policy push to encourage equity participation through the NISA tax-advantaged account framework. The cat had sat on the stove in 1989, and three decades of nominal cold draws were not enough to coax it back. Japanese households were not irrational. They were sampling the data the world had given them, and the data, restricted by the sampling rule itself, never produced a draw large enough to overwhelm 1989. The lesson is not that Japanese households should have ignored the 1989 outcome. It is that, once a single outcome had been treated as an estimate of the equilibrium mean, no information short of total re-sampling could dislodge it.
The United States retail investor, 2000 to 2013. The dot-com correction that began in March 2000 and concluded around October 2002 erased roughly seventy-eight per cent of the Nasdaq Composite’s value at its trough. The 2008 financial crisis, beginning the long retracement in October 2007 and concluding in March 2009, took the S&P 500 down by approximately fifty-seven per cent peak-to-trough on a total-return basis. Investment Company Institute data on long-term mutual-fund flows show that net flows into United States equity mutual funds were essentially zero or negative every year from 2008 through 2012, even as the index recovered all of its losses by 2013. Retail investors who lived through the 2000 and 2008 draws had hot-stoved out of equity. Households who took the 2009 right-tail draw — those who held positions through the trough — saw the running average corrected. Households who disengaged in 2008 took no further draws and saw nothing corrected. The Morningstar “Mind the Gap” series, which has measured the investor-return gap each year since 2005, has consistently found that retail-investor cash-flow-weighted returns lag fund time-weighted returns by between one and two per cent per annum, with the largest gap concentrated in the most-volatile fund categories. The gap is not a story about manager selection. It is the hot-stove effect, measured in basis points.
The counter-measure framework
The first task in counter-acting a bias whose mechanism is asymmetric sampling is to construct a sampling rule that does not allow disengagement to be the default response to a punishing draw. Three operational disciplines, in combination, accomplish this without requiring the investor to abandon the broader prudential framework of position sizing and risk control.
The pre-committed re-sampling protocol. Before a position is taken, the investor specifies, in writing, the conditions under which the position will be re-sampled following a loss. The conditions are stated in terms of objective triggers — a defined calendar interval, a defined drawdown level, a defined change in the fundamental thesis — rather than in terms of post-loss conviction, which the hot-stove mechanism reliably corrupts. The point of the pre-commitment is to ensure that the second draw is taken at all. The size of the re-sample need not match the size of the original position; in many cases a re-sample at twenty to thirty per cent of the original allocation will produce sufficient new information to update the estimate without exposing the investor to a position that may, on the second look, still be unattractive. The discipline is not “buy more after a loss.” The discipline is “look again after a loss,” with size and timing pre-specified.
The decoupling of the security-specific lesson from the category lesson. A punishing draw on a single security carries two distinct pieces of information: information about the security and information about the category to which the security belongs. The hot-stove mechanism conflates the two, because the investor’s sampling rule is applied at the category level — “I have been burned by emerging markets,” “I have been burned by Indian small-caps,” “I have been burned by biotech” — rather than at the security level. The discipline is to write down, before the position is taken, what the position is being held to learn about. If the thesis is security-specific, the loss carries no category information at all and must not be allowed to terminate sampling at the category level. If the thesis is category-level, the loss carries security-specific noise that must not be allowed to dominate the category estimate. The bookkeeping is unglamorous but it is the only available defence against the asymmetric translation of one draw into a permanent verdict on an entire universe.
The shadow-position register. For every category from which the investor has disengaged, the investor maintains a shadow allocation — a notional position, marked to market, that records what the disengaged category has subsequently done. The shadow allocation is not a trade; it is a sampling instrument. Its purpose is to ensure that the data the disengaged category produces is collected even when the actual portfolio has stopped collecting it. At a quarterly or annual review, the shadow register is examined against the live portfolio, and any category whose shadow has materially outperformed the realised allocation is flagged for re-sampling review under the protocol described above. The shadow register is the only mechanism by which an investor can reliably know that the cat has been sitting on a cold stove for some time, and that the discomfort of returning to it is no longer informational but reflexive.

How long-term-equity practitioners addressed the bias
Sir John Templeton built one of the longest sustained outperformance records in twentieth-century equity investing by operationalising, decades before it had an academic name, a refusal to allow a punishing draw to terminate his sampling of a category. His most celebrated single decision — the purchase of small parcels of one hundred and four United States equities trading below one dollar per share in 1939, financed with borrowed money on the day Germany invaded Poland — was a deliberate re-sampling of a category that the broader investor base had hot-stoved out of after the 1929-1932 collapse and the long depression that followed. Equally instructive is Templeton’s 1962 entry into Japanese equity, at a time when most Western capital had concluded that Japan was a country whose post-war recovery had stalled. Templeton wrote, in correspondence later collected by his successor at Templeton Funds, that the discipline was not to seek out hated assets for their hatedness; it was to ensure that no asset class was excluded from the consideration set by virtue of having most recently disappointed. The point of the discipline of “buying at the point of maximum pessimism,” in Templeton’s words, was not contrarianism. It was the construction of a sampling rule that did not permit disengagement to be permanent.
Howard Marks, in three decades of Oaktree Capital Management memos to clients, has returned repeatedly to the asymmetry that Denrell and March formalised. The 2008 memo “The Limits to Negativism,” written in October of that year as distressed credit prices made forced-selling histories at multiples of recovery value, opens with the observation that the same intelligence that allows an investor to identify legitimate reasons for caution can, when extended without limit, prevent the investor from ever re-engaging with categories that have priced in those reasons. The 2012 memo “What’s Behind the Downturn?” reiterates the point. The 2020 memo “Latest Thinking,” written in the middle of the COVID-19 drawdown, makes it explicit: the question facing the investor in a punished category is not “is this asset dangerous?” but “is the price compensating me for the danger?” The discipline at Oaktree, as Marks has described it across two books and forty years of memo correspondence, is to require that any decision to remain disengaged from a category be re-justified on every cycle on the basis of current valuation, not on the basis of the most recent disappointment. The shadow-position register described above is, in effect, the Oaktree practice generalised to a single investor’s portfolio.
Key Takeaways
- The hot-stove effect is not a story about emotion or courage; it is a story about asymmetric sampling. Continued engagement with a category produces more information, and disengagement produces none. Estimates of categories from which the investor has disengaged after a punishing draw are systematically and permanently biased downward.
- The bias is heaviest where outcome variance is highest, which means the categories most likely to be misjudged are precisely the cyclical, recovering, and high-tail-premium categories that academic finance suggests offer the deepest long-horizon returns.
- Regulator data — the FCA Financial Lives 2024 Survey, the Federal Reserve Survey of Consumer Finances 1989-2022 series, and the Investment Company Institute fund-flow series — all document the same phenomenon at population scale: cohorts hot-stoved by a single drawdown remain underweight equity for a decade or more, missing the bulk of the subsequent recovery.
- The counter-measure is procedural, not psychological. Three disciplines — the pre-committed re-sampling protocol, the decoupling of security from category, and the shadow-position register — together ensure that the sampling rule does not allow disengagement to be the default response to a punishing draw.
- The defining practitioners of long-horizon equity — Sir John Templeton through six decades of cross-cycle category re-entry, and Howard Marks through forty years of memo correspondence on the asymmetric cost of sustained negativism — operationalised these disciplines decades before the academic literature gave the underlying mechanism its name. The architecture is available. The only requirement is the deliberate construction of a sampling rule that the investor’s own punishments are not permitted to terminate.
— Manish Goel, FCA / NorthPath Advisory OÜ / Tallinn, Estonia
|
Important. |